
.avif)

Table of Contents
Start your free trial.
Unlock Better Testing Workflows in Kubernetes — Try Testkube for Free

Unlock Better Testing Workflows in Kubernetes — Try Testkube for Free


Table of Contents
Executive Summary
Looking at test logs and trying to find that key line that will help you debug an issue can be a simple task when dealing with logs that are 10 to 30 lines long. But what happens when you’re dealing with longer log files? As developers and testers alike, we’ve all been there.
As we grapple with the complexities of containerized applications orchestrated by Kubernetes, one critical aspect stands out for identifying issues, troubleshooting anomalies, and optimizing performance: having accurate and useful logs.
In Testkube’s continued pursuit of streamlined testing processes and enhanced observability for your Kubernetes applications, we’ve worked on bringing an important improvement to your logs to help you troubleshoot failures and identify issues faster.
With Testkube’s new Log Highlights, you can turn those hours of log reviewing into minutes:
Keyword Highlighting in Test Logs
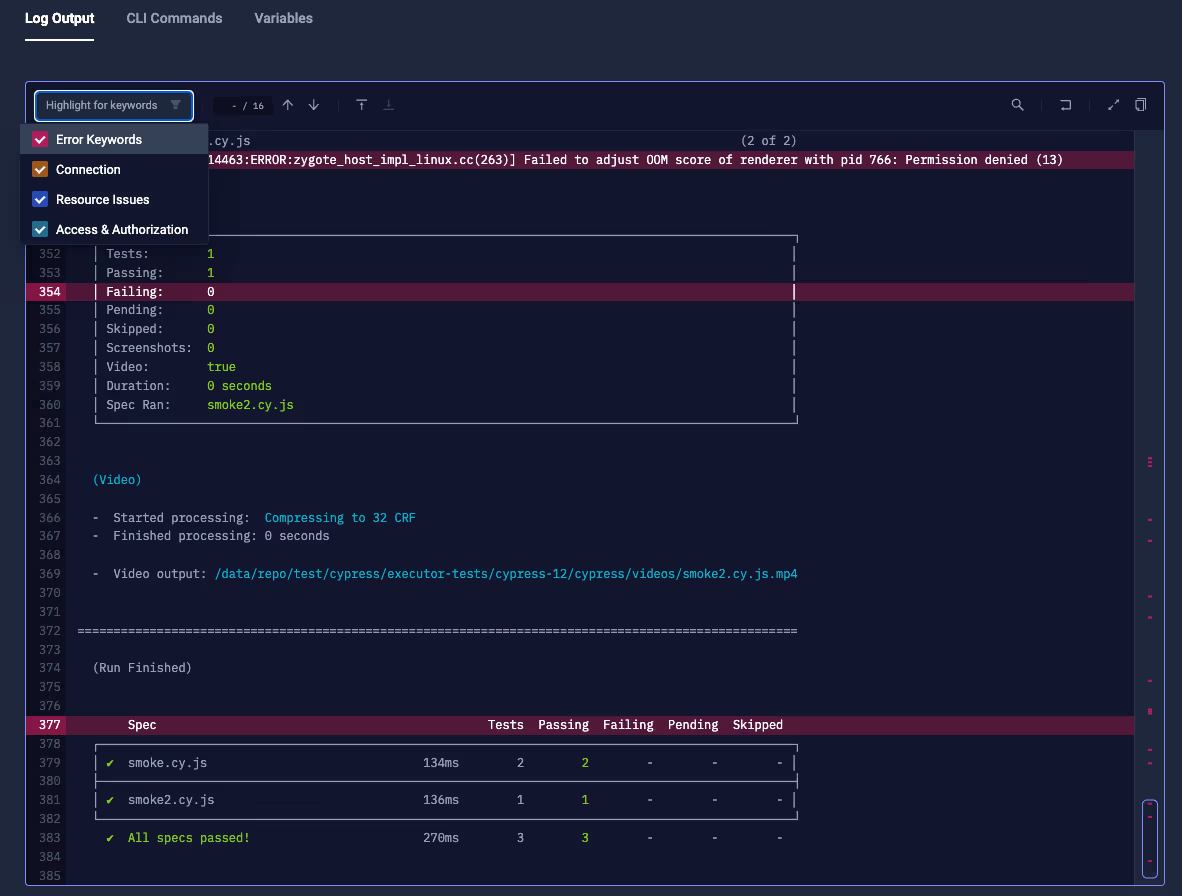
Starting now, Testkube automatically highlights and flags keywords containing pre-defined words such as `error`, `fault`, `exception`, `warning`, referring to Error, Connection, or Resource and Access Issues.
This helps you quickly skim through the log file without missing relevant information from the test output.
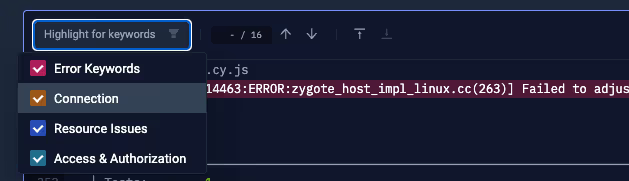
You’ll be able to choose which words to highlight from a dropdown, and Testkube’s UI will do the rest. Giving you a multi-colored output including the selected keywords.
On top of that, you’ll be able to identify highlighted words from an eagle-eye view on the right side of the log output section - clicking on each colored section will take you directly to the highlighted line.
Getting Started with Improved Log Highlights
Getting started with our log highlights experience is easy:
- Sign into Testkube
- Install Testkube in your cluster
- Add your tests or create new ones from your Testkube dashboard or Testkube CLI
- Start running your tests
- Head over to any test execution and click on it to open the Log View
- Select the log keywords to highlight from the dropdown
- Start debugging efficiently!
To try this and more of our new features, sign in to your Testkube account or sign up today! You can find the resources you need to get started in our documentation, or you can always contact us to schedule a demo. Join our Slack community for guidance and support. Happy testing!
About Testkube
Testkube is the open testing platform for AI-driven engineering teams. It runs tests directly in your Kubernetes clusters, works with any CI/CD system, and supports every testing tool your team uses. By removing CI/CD bottlenecks, Testkube helps teams ship faster with confidence.
Get Started with a trial to see Testkube in action.


.png)