
Table of Contents
Further Reading


.avif)
.png)

.jpg)
.jpg)


What Is Centralized Test Observability?
Centralized test observability is the ability to view, analyze, and correlate test results, logs, and metrics from multiple sources in one unified location. It provides full visibility into testing activity across environments, enabling teams to quickly identify failures, trends, and performance bottlenecks.
Unlike traditional test reporting that focuses on individual test runs, centralized observability creates a comprehensive view of quality across your entire testing ecosystem. It connects data from unit tests, integration tests, end-to-end tests, performance tests, and more into a single source of truth.
Why Centralized Test Observability Matters
Modern testing environments are distributed across CI/CD pipelines, microservices, and multiple cloud or Kubernetes clusters. Without a centralized view, understanding test outcomes becomes fragmented and time-consuming. Teams struggle to trace issues across systems, correlate failures with infrastructure changes, and gain actionable insights into overall quality and reliability.
Key Challenges Without Centralized Observability
Teams without centralized test observability face several critical challenges:
Fragmented visibility: Test results scattered across Jenkins, GitHub Actions, GitLab CI, and other tools make it impossible to see the complete picture of software quality.
Slow incident response: When production issues arise, teams waste valuable time hunting through multiple dashboards and log systems to find relevant test data.
Lost context: Without correlation between test failures and infrastructure events, teams struggle to determine whether issues stem from code changes, configuration drift, or environment problems.
Limited trend analysis: Historical test data stored in different systems prevents teams from identifying patterns, tracking quality improvements, or measuring the impact of process changes.
Siloed teams: Development, QA, and operations teams work from different data sources, leading to miscommunication and duplicated investigation efforts.
How Centralized Observability Solves These Problems
Centralized test observability solves this by:
- Aggregating results from diverse tools and frameworks into a single platform
- Providing end-to-end visibility into test execution and environment health across all stages of the delivery pipeline
- Accelerating root-cause analysis through unified data context that connects test outcomes with system telemetry
- Improving collaboration between development, QA, and platform teams through shared dashboards and common terminology
- Enabling proactive quality management by surfacing trends before they impact production
- Reducing mean time to resolution (MTTR) by providing immediate access to relevant logs, metrics, and execution history
By centralizing test insights, teams can maintain continuous quality visibility and make data-driven improvements to reliability and performance.
How Centralized Test Observability Works
Centralized observability platforms collect data from test runs, including execution results, logs, artifacts, and performance metrics. This information is indexed and visualized through dashboards or APIs. Teams can query results by test type, environment, or timeframe to identify anomalies or recurring failures.
Data Collection and Aggregation
The foundation of centralized test observability is comprehensive data collection. Modern platforms automatically gather:
- Test execution results: Pass/fail status, duration, retry counts, and flakiness indicators
- Detailed logs: Console output, error messages, stack traces, and debugging information
- Performance metrics: Response times, resource utilization, throughput, and latency measurements
- Test artifacts: Screenshots, videos, network traces, and code coverage reports
- Environment metadata: Cluster details, node information, configuration versions, and dependency versions
- Contextual data: Commit hashes, branch names, pull request numbers, and deployment identifiers
Integration Architecture
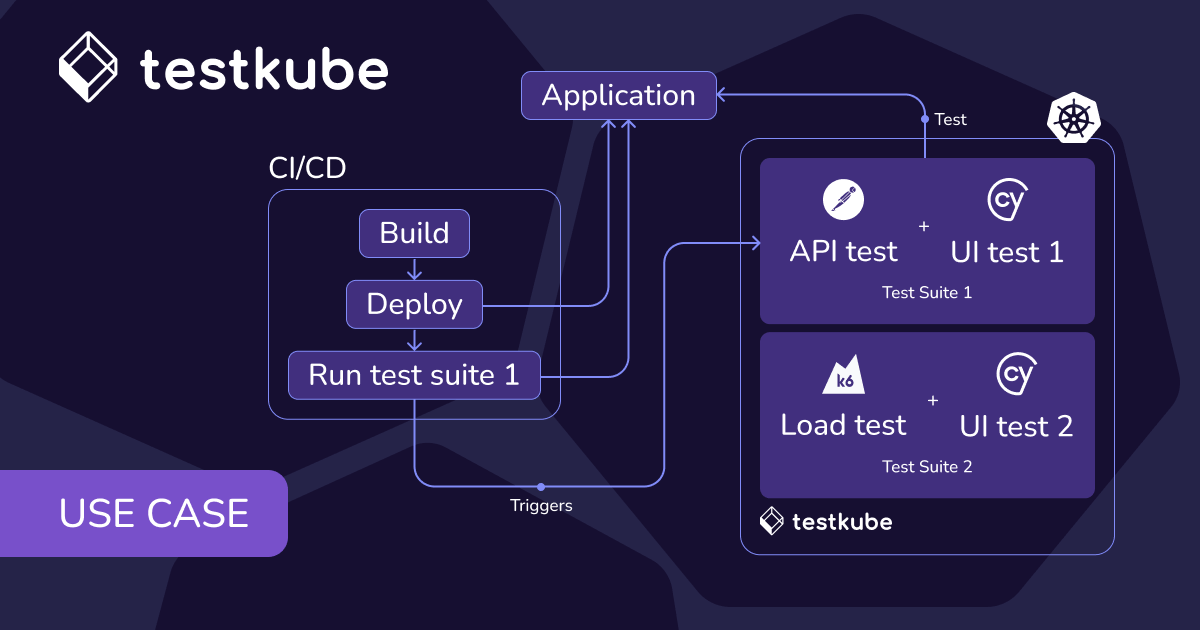
Integrations with CI/CD systems, Kubernetes clusters, and monitoring tools allow test data to flow continuously into a shared observability layer. This creates a feedback loop between testing, infrastructure monitoring, and deployment performance, ensuring every stage of delivery contributes to a unified quality picture.
Common integration points include:
- CI/CD pipelines: Jenkins, GitLab CI, GitHub Actions, CircleCI, Azure DevOps
- Container orchestration: Kubernetes, OpenShift, Amazon EKS, Google GKE
- Testing frameworks: JUnit, pytest, Jest, Selenium, Cypress, k6, Playwright
- Monitoring systems: Prometheus, Grafana, Datadog, New Relic, Elastic Stack
- Version control: GitHub, GitLab, Bitbucket for commit and pull request correlation
Visualization and Analysis
Centralized platforms transform raw test data into actionable insights through:
- Real-time dashboards: Live views of test execution status across all environments
- Historical trending: Charts showing quality metrics over time, highlighting improvements or degradation
- Failure analysis: Automated grouping of similar failures to identify systemic issues
- Comparison views: Side-by-side analysis of test runs across different branches, environments, or time periods
- Custom reports: Filtered views tailored to specific teams, projects, or quality gates
Real-World Examples
Organizations implementing centralized test observability see immediate improvements in quality and velocity:
- E-commerce platforms: QA teams use observability dashboards to monitor thousands of automated test runs across multiple environments, tracking checkout flow reliability across different regions and payment providers in real time.
- Financial services: Platform engineers correlate test failures with pod restarts or node pressure in Kubernetes to pinpoint root causes, reducing investigation time from hours to minutes when payment processing tests fail.
- SaaS companies: SRE teams analyze long-term reliability trends by overlaying test data with infrastructure metrics and deployment timelines, identifying that performance degradation coincides with specific database migration patterns.
- Healthcare technology: DevOps teams track API contract test results alongside service deployment metrics, preventing breaking changes from reaching production by catching integration issues during staging.
- Media streaming: Performance engineers monitor load test results centrally across geographic regions, optimizing content delivery by correlating video playback quality with CDN performance and backend service health.
Key Benefits
Centralized test observability delivers measurable improvements across the software delivery lifecycle:
Unified Visibility
View all test data across tools, pipelines, and environments in a single interface. Eliminate context switching between different reporting systems and create a shared understanding of quality across the organization.
Faster Debugging
Correlate test logs, metrics, and cluster events to identify root causes quickly. Reduce mean time to resolution by providing engineers with immediate access to all relevant information in context.
Improved Collaboration
Give QA, DevOps, and SRE teams shared context for investigation. Break down silos by providing a common language and shared data source for discussing quality issues.
Trend Analysis
Track performance and reliability metrics over time to measure the impact of process improvements, identify emerging patterns, and quantify technical debt.
Proactive Insights
Detect anomalies before they cause production incidents. Use historical data and machine learning to identify unusual patterns that indicate quality degradation.
Compliance and Audit Support
Maintain comprehensive test execution history for regulatory compliance, audit trails, and quality certification processes.
Cost Optimization
Identify redundant test coverage, optimize test execution time, and reduce infrastructure costs by understanding resource utilization patterns across your testing portfolio.
How It Relates to Testkube
Testkube provides centralized test observability for Kubernetes-native testing by consolidating results, logs, and metrics from all test types into a single interface.
Unified Testing Platform
With Testkube:
- Unified results: Every test run, whether functional, load, API, or integration, is stored and visualized in one place for complete visibility across your entire testing strategy.
- Aggregated logs: Testkube captures and stores logs from each executor pod, enabling detailed debugging without leaving the dashboard or accessing Kubernetes directly.
- Historical insights: Teams can analyze past runs, compare performance across releases, and detect regressions over time using built-in trending and comparison features.
- Environment correlation: Because Testkube runs inside Kubernetes, it provides context on the environment where each test executed, helping teams relate failures to infrastructure or deployment changes with complete cluster awareness.
- Native Kubernetes integration: Testkube understands Kubernetes resources, namespaces, and scheduling, providing observability that reflects the actual runtime environment of containerized applications.
Seamless Observability Integration
- Integrations: Testkube supports exporting test data to external observability stacks such as Prometheus, Grafana, or Elastic Stack, enabling correlation with broader system metrics and creating a complete observability picture.
- Webhook support: Trigger notifications and downstream processes based on test results, integrating quality signals into existing incident management and alerting workflows.
- API access: Programmatic access to all test data enables custom dashboards, automated quality gates, and integration with data warehouses for long-term analysis.
Scale and Performance
- Scalable visibility: As test workloads scale across clusters, Testkube maintains consistent reporting and traceability from a single source of truth, whether running hundreds or thousands of tests daily.
- Distributed execution: Run tests across multiple clusters and regions while maintaining centralized visibility into all results and execution metadata.
This approach turns test results into actionable operational intelligence, bridging the gap between quality engineering and system observability.
Centralized Test Observability vs Traditional Test Reporting
Best Practices
Implementing centralized test observability effectively requires strategic planning and consistent execution:
Data Collection Strategy
- Centralize test data across all tools and frameworks: Ensure every testing tool, from unit test runners to load testing platforms, sends results to your centralized observability system.
- Standardize metadata tagging: Apply consistent labels for environment, application version, test type, and team ownership to enable effective filtering and analysis.
- Capture comprehensive context: Include commit information, build numbers, deployment identifiers, and infrastructure state with every test run.
Analysis and Visualization
- Correlate test metrics with application and infrastructure telemetry: Connect test failures to CPU spikes, memory pressure, network latency, or deployment events to accelerate root cause analysis.
- Use dashboards to visualize trends and recurring issues: Create role-specific views that highlight the most relevant metrics for different teams and responsibilities.
- Implement alerting for critical patterns: Set up notifications for significant increases in failure rates, performance degradation, or test flakiness.
Historical Data Management
- Store historical results to measure long-term reliability improvements: Retain test data for months or years to track quality trends, measure the impact of initiatives, and support capacity planning.
- Automate alerts for failure thresholds or performance regressions: Define quality gates based on historical baselines and trigger automated responses when thresholds are exceeded.
- Regular data review cycles: Schedule periodic reviews of observability data to identify improvement opportunities and validate that monitoring remains relevant.
Team Enablement
- Train teams on observability tools: Ensure all team members understand how to access, interpret, and act on test observability data.
- Establish shared quality metrics: Define common KPIs that all teams track and work to improve collaboratively.
- Document investigation workflows: Create runbooks that leverage centralized observability data for common failure scenarios.
Common Pitfalls
Avoid these frequent mistakes when implementing centralized test observability:
Fragmentation Issues
- Relying on fragmented dashboards across different CI/CD systems: Consolidate visibility into a single platform rather than maintaining separate dashboards for each tool or pipeline.
- Tool sprawl without integration: Adding more testing tools without connecting them to centralized observability creates more silos rather than solving visibility problems.
Data Quality Problems
- Ignoring logs and metrics in favor of pass/fail summaries: Binary pass/fail status provides limited insight compared to detailed logs, performance metrics, and execution context.
- Inconsistent or missing metadata: Without proper tagging, test results become difficult to filter, group, and analyze effectively.
Historical Blindness
- Failing to retain test history for regression analysis: Short retention periods prevent teams from identifying long-term trends or comparing current quality to past baselines.
- Not tracking quality metrics over time: Without historical tracking, teams cannot measure whether quality initiatives are succeeding or quantify improvement.
Context Loss
- Not tagging tests by environment or version, reducing traceability: Missing contextual information makes it impossible to determine whether failures are environment-specific or code-related.
- Disconnecting tests from deployments: Without linking test runs to specific deployments or releases, teams lose the ability to correlate quality changes with code changes.
Integration Gaps
- Overlooking integration with existing observability systems: Failing to connect test data with application performance monitoring and infrastructure metrics limits the value of both systems.
- Building custom solutions instead of adopting platforms: Organizations often underestimate the ongoing maintenance cost of custom observability solutions.