Table of Contents
Start your free trial.
Start your free trial.

Start your free trial.


Table of Contents
Executive Summary
- Test visibility in CI/CD requires structured outputs (logs, metrics, artifacts) and centralized observability.
- Traditional stacks (Prometheus, Grafana, Loki, etc.) work but demand heavy setup and ongoing maintenance.
- Debugging CI/CD tests is easier with full artifacts, environment checks, and tracing.
- Testkube simplifies observability by orchestrating tests, surfacing logs/metrics/artifacts automatically, and integrating directly with CI/CD pipelines.
- Unified testing in Kubernetes (functional, load, API, UI, custom) is possible without extra glue code, giving both leaders and engineers the visibility they need.
Why Test Visibility Matters
Effective test visibility requires seamless observability. This visibility is achieved through observability, which is the foundational approach built on three core pillars: monitoring, logging, and tracing. Observability is considered critical for continuously driving better business outcomes and should ideally be implemented within an organization from day zero.
CI/CD Solutions can help with the test visibility to some extent but they are not built for it. The only outcome of “Pass/Fail” alone doesn’t suffice, and individual test logs and artifacts are spread out across pipeline builds, and teams require test observability that captures system health, performance, and test outcomes in one place for efficient troubleshooting of test results.
However, not all data is useful to every stakeholder. To maximize efficiency, visibility must be tailored: leaders need summarized strategic metrics, while engineers need granular diagnostic details like logs, traces, and artifacts to act quickly.
Strategic Test Visibility
Managerial teams and leadership require a high-level view that focuses on governance, risk mitigation, and strategic growth. Leaders don’t need to parse raw logs or debug traces, that’s engineering territory. What they need is summarized, reliable visibility that helps them make informed calls about stability, scalability, and release confidence. This strategic visibility must continuously drive better business outcomes. Key Metrics that matter to them include:
- Product health status: Decision makers want to know majorly two things: Are we stable and are incidents trending down? Test results aggregated over time show whether failures are random or trending upward. Error counts and incident frequency highlight if the system is improving or regressing. This view shifts conversations from generic “we had some failures” to data-backed “we’ve reduced incident frequency by 20% this quarter.” Expecting this kind of information from CI pipeline monitoring is unrealistic because they are not built for this purpose.
- Scalability and Performance: Visibility must confirm how much the solution or product is scalable and if it is cost-optimized while scaling. Performance test results indicate how systems behave under load and whether latency or throughput degrade at scale. Coupling these results with cost metrics helps leaders see if scaling is efficient or simply expensive. The strategic question becomes here that can we handle growth sustainably while staying within budget?
- Feature velocity and risk: Every release carries risk. Managers track whether new features improve quality or introduce churn. Release velocity metrics show how fast features are moving to production. Test visibility ties velocity to risk by exposing regression rates or rollback frequency. This ensures innovation doesn’t come at the expense of reliability.
Together, these metrics turn test visibility into a decision-making tool. Leadership gets the confidence to release faster, scale smarter, and course-correct before small issues snowball into business risks.
Granular Test Visibility
While leaders rely on summaries, engineers need raw, actionable data. Their day-to-day involves debugging failures, firefighting outages, and drilling down to root causes. For them, visibility isn’t about trends. It’s about having the right alert at the right moment.
- Artifacts, Logs and Traces: Engineers depend on detailed artifacts, logs and distributed traces to see what really happened both inside the tests themselves and the applications they are testing. Logs provide the full execution context for failed tests or deployments. Traces map requests across services, helping pinpoint bottlenecks or latency spikes in complex architectures. This depth cuts down the guesswork and accelerates root cause analysis.
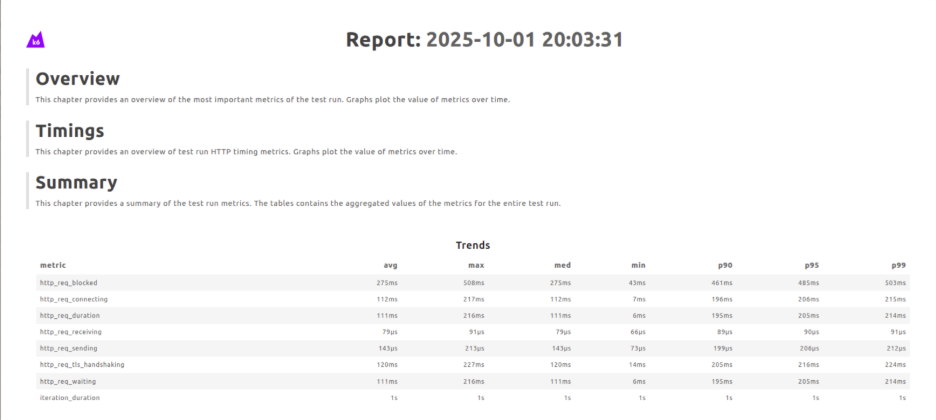
- Metrics & Dashboards: Generic CPU or memory charts aren’t enough. Engineers need application or resource specific insights like error rates that show regressions, latency that tracks performance degradation and throughput to measure system capacity. Custom dashboards in tools like Grafana make these insights immediately visible, allowing engineers to spot anomalies in real time.
Artifacts such as JUnit reports, screenshots, or full log bundles are critical. They let engineers reproduce and analyze issues without rerunning entire pipelines, saving time and reducing friction.
Making Visibility Real with Testkube
Automated test visibility closes the loop by making failures visible and actionable. In a traditional test visibility CI/CD pipeline, this could mean:
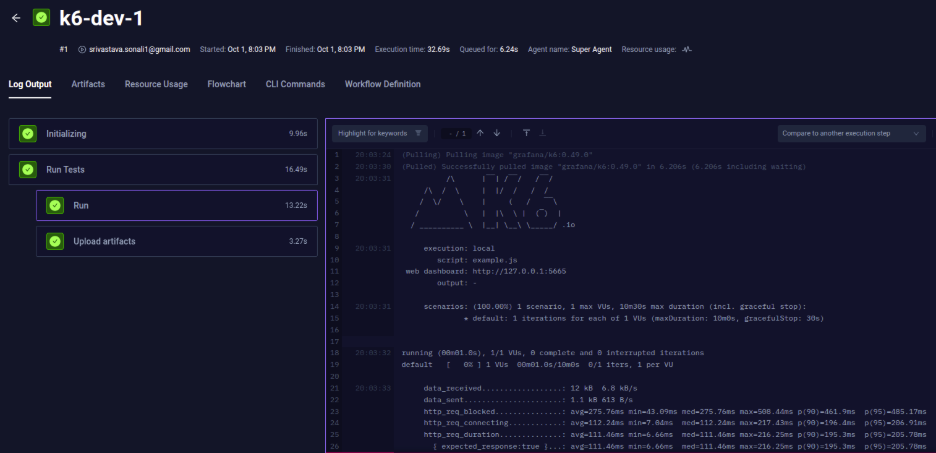
- Collecting and visualizing pipeline test data such as pass/fail results, logs, metrics, and artifacts.
- Feeding CI execution events into observability systems to track trends over time.
- Triggering alerts or automated actions when builds or tests fail.
This setup works but comes with a cost as it requires scripting and stitching together multiple tools, maintaining custom integrations, and support scaling.
As the product scales, pipelines inevitably grow more complex to support new features, higher traffic, and different testing needs like functional, load, and integration. While observability stacks like Prometheus, Grafana, and Loki can be wired into CI pipelines, configuring them for each test type quickly becomes heavy and time-consuming. Instead of investing cycles in building and maintaining that stack from scratch, you can skip the overhead and rely on automated test orchestration with Testkube.
With Testkube, tests are triggered directly within your CI pipeline, and results are surfaced automatically. This gives strategic visibility for decision-makers and granular visibility for engineers without extra integration effort. Visibility isn’t bolted on later rather it’s part of the workflow from the start.
Testkube can trigger test workflows from your CI/CD pipeline using native integrations, automating Testkube CLI in your CI/CD tool or by directly calling the Testkube API. This flexibility helps engineers with seamless integration to their existing infrastructure setup. Let us understand some more capabilities that it provides to help engineers ship quality in time.
Unified Test Orchestration
Run functional, load, API, or custom tests in Kubernetes by configuring Test Workflows in Testkube. No need to manage separate pipelines for different test types, everything is orchestrated from one place.

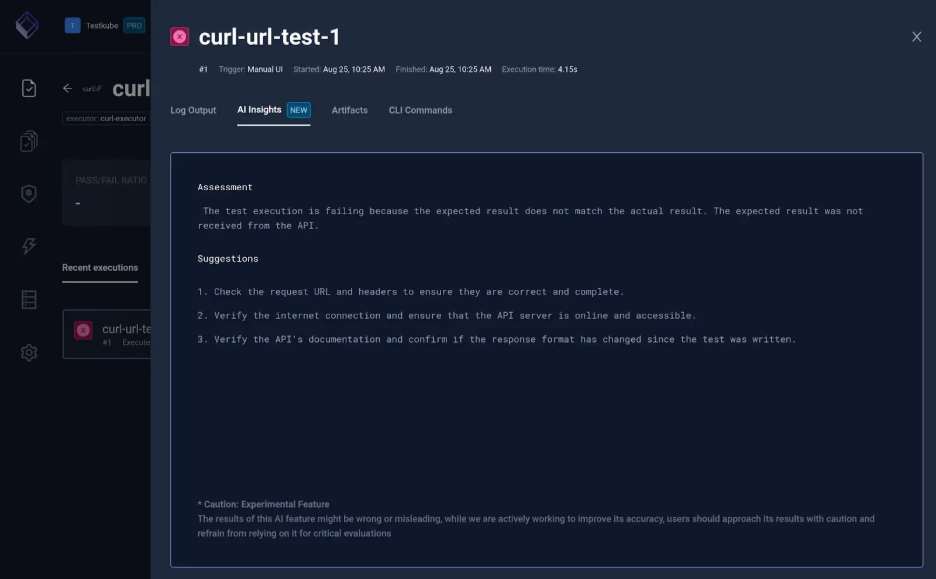
Performance trends with AI Insights
Leverage AI-driven insights to automatically identify patterns, anomalies, and performance trends in your tests. This helps teams detect regressions early and optimize performance without manual analysis. Testkube’s AI Analysis feature evaluates the issue and suggests resolution.
Centralized Results and Artifacts
Collect logs, metrics, and reports in one centralized location. Leaders get high-level summaries for decision-making, while engineers have full access to artifacts for deep debugging and root cause analysis.
Insights and Status Page
Monitor all your services and tests from a single consolidated dashboard. Quickly see which tests are passing, failing, or running, and get a real-time view of system health across your CI/CD pipeline.


Testkube simplifies testing by bringing orchestration, insights, and visibility into a single workflow. Teams spend less time wiring tools together and more time acting on clear signals, whether that’s spotting performance regressions early, debugging with full context, or tracking overall system health. These capabilities make testing not just scalable, but actionable, so releases can move forward with speed and confidence.
Get started with Testkube to integrate policy-driven testing into Kubernetes. Automate compliance checks, validate workloads against resource policies, and ensure application reliability with minimal overhead. Join the Testkube Slack community to start a conversation or read Testkube documentation to start building fault-tolerant, automated test pipelines tailored to the organization's infrastructure.
Frequently Asked Questions
About Testkube
Testkube is the open testing platform for AI-driven engineering teams. It runs tests directly in your Kubernetes clusters, works with any CI/CD system, and supports every testing tool your team uses. By removing CI/CD bottlenecks, Testkube helps teams ship faster with confidence.
Get Started with a trial to see Testkube in action.
.png)