
Test Observability That Makes Every Result Actionable
Testkube's TEST OBSERVABILITY brings visibility to testing, helping teams not just run their tests, but visualize, monitor, and analyze them as a first-class part of their engineering workflows.


The Problem with Invisible Test Results
✦ Diverse outputs and formats
Different test frameworks produce different kinds of reports, log formats, and artifacts. For builds that involve multiple tool types, parsing and normalizing results for cross-test comparison is non-trivial.
✦ Scattered data and lost context
When testing distributed applications, logs, artifacts, performance metrics, and test execution results may be stored in separate systems or in systems not accessible to the engineer ultimately tasked with troubleshooting and RCA.
✦ Lack of historical and aggregate visibility
It is hard to see trends over time (test duration, pass/fail rates, flakiness) without keeping and aggregating past execution data. Many systems discard older runs or only show recent data.
✦ Flakiness and inconsistent test results
Tests or workflows that sometimes pass and sometimes fail reduce confidence. Detecting flakiness requires looking at multiple past runs, identifying status transitions, and correlating test behavior to external events.
✦ Operational profiling gaps
Understanding resource consumption for automated test execution in delivery pipelines is key to identifying bottlenecks and ensuring test consistency and cost-optimized infrastructure utilization.
A Single Pane of Glass for Test Execution Data
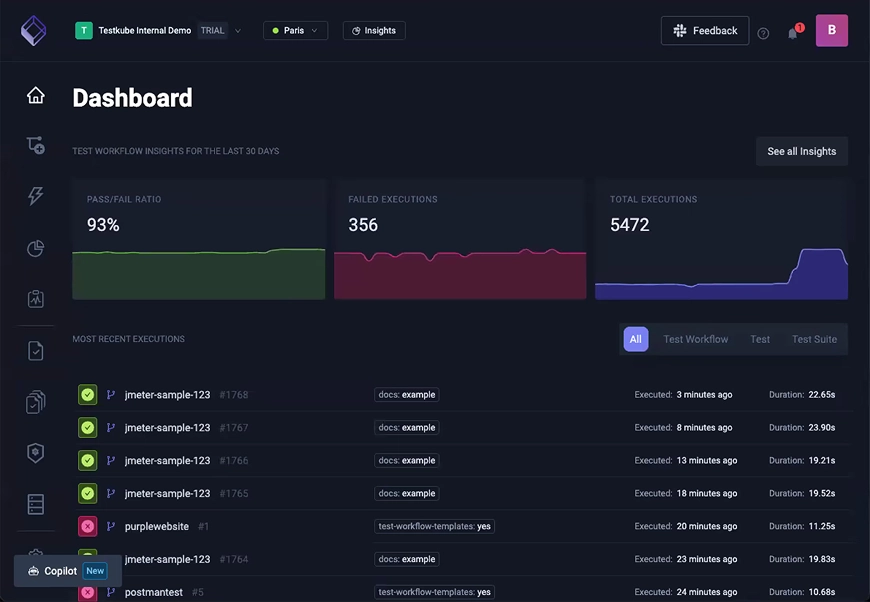
Testkube transforms test execution into an observable system by centralizing, monitoring, and analyzing test data in its control plane.
Instead of treating tests as isolated scripts, teams get a unified observability framework that aggregates metrics, logs, and artifacts across all test executions.
Built for Deep Visibility, Not Just Pass/Fail
✓ Unified artifact collection
Testkube automatically collects logs and artifacts (including JUnit XML reports, videos, HTML reports) as part of each test workflow execution.
✓ Centralized results
Aggregates metrics, logs, and artifacts for all test executions in one place, providing a single source of truth for troubleshooting and examining historical trends.
✓ Flakiness and workflow health metrics
Testkube computes metrics like Workflow Health and Flakiness to flag unstable workflows for any testing tool, regardless of how it was scheduled.
✓ Log highlighting and comparison
Logs returned to the control plane can be highlighted for keywords and categories. Compare logs between runs to diagnose failures quickly.
✓ AI analysis and insights
For failed tests, the Testkube AI Assistant can analyze logs and suggest likely causes. The Testkube MCP Server integrates into AI agents for advanced use cases like automated troubleshooting.
✓ Modern observability integrations
Connect Testkube into your existing observability stacks for comprehensive visibility across production and testing systems.

Customer Success Story
Real-World Use Cases
See how Testkube's Test Observability adapts to your unique testing needs across different environments and workflows.
- Flakiness Detection and Resolution
- Cross-Framework Result Normalization
- AI-Driven Failure Analysis
- Historical Trend Analysis
- Resource Usage Profiling
Make Your Test Results Visible, Analyzable, and Actionable
Bring your stack and goals. We'll show how Testkube transforms test observability so you troubleshoot faster and ship with confidence.
Talk through your current setup
CI, test types, frameworks, bottlenecks like scattered artifacts or inconsistent test results.
Get clear options
Unified reporting, flakiness detection, AI-driven analysis, how Testkube fits with your observability stack.
Get a clear path forward
We'll show you what observability looks like for your tests and outline a simple pilot you can validate in days.