Table of Contents
Start your free trial.
Start your free trial.

Start your free trial.


Table of Contents
Executive Summary
When we’re coding with AI assistants, it’s easy to miss a subtle but important shift: development now runs at two speeds. On one hand, code generation happens in your IDE at 10x the speed, while on the other, validation happens at 1x speed - or slower - outside of your IDE.
Developers often jump between GitHub to check the PR status, CI/CD dashboard to monitor the build, Kubernetes logs to debug a test failure, Slack to notify your team, and back to your IDE to fix the issue. Five tools. Fifteen minutes lost. And you're still not sure what actually failed.
The bottleneck isn't code generation anymore - it's the validation maze. Atlassian's 2025 State of DevEx report found that 50% of developers lose 10+ hours per week to organizational inefficiencies, with tool fragmentation ranking as a top friction point.
Traditional CI/CD pipelines automated test execution, but they didn't solve validation coordination. The tests run automatically, but understanding and resolving failures still requires manually correlating data across GitHub, CI dashboards, Kubernetes logs, and Slack.
In this post, we'll show you how continuous validation closes this loop: running tests, analyzing failures, and surfacing fixes - all in the same environment where your AI assistant writes code.
Where Traditional CI/CD Falls Short with AI-Generated Code
Back in the day, developers wrote code for hours, commit once or twice a day, tests run in a pipeline, results come back in 10-15 minutes. Traditional CI/CD pipelines were designed to handle exactly this.
But AI flipped this model. Your coding assistant completes a feature in a few minutes, you raise a PR only to realise that your CI/CD pipeline has queued your build behind other 4 PRs. You get the results after 35 mins. By that time you’ve switched to some other tasks and have lost the context.
So a pipeline designed to handle 50 commits per week is now expected to handle 200-300 commits! This is what becomes a bottleneck.
But volume is just one piece of the puzzle. Here are three fundamental problems that arise when traditional CI/CD pipelines meet modern AI coding agents.
Time-to-Feedback: Validation Happens After the Fact
CI/CD pipelines execute tests after you commit and open a PR. This made sense when writing code took hours - you'd batch up changes and validate them comprehensively before merging.
But when AI generates a complete feature in 10 minutes, waiting another 25 minutes for CI/CD to queue, execute, and report results means you're spending more time waiting than coding.
By the time those results arrive, you’ve moved on to something else. Now you’re stuck retracing your steps just to remember what broke - and why.
Failure Context: Pass/Fail Isn't Enough
Traditional CI/CD pipelines tell you tests failed. They don’t tell you why. When an integration test fails, was it because your code has a bug? Because a pod restarted during the test run? Because the cluster hit resource limits?
To answer these questions, you leave your IDE and manually correlate data across GitHub, CI logs, Kubernetes events, and service metrics. The pipeline tells you what failed, not why. To figure that out, you’re hopping between dashboards like a detective chasing clues across five different tools.
Environment Parity: Local Development Doesn't Match Production
AI assistants work in your local IDE with mocked dependencies, unlimited resources, and simplified networking. Code that passes local tests and CI pipeline validation can still fail in production-like environments where Kubernetes resource limits cause OOMKills, service mesh policies block traffic, or database connection pooling behaves differently under load.
Most CI/CD systems run tests in isolated, simplified environments that don't reflect the actual runtime constraints your code will face.
What Continuous Validation Actually Looks Like
Continuous validation flips your traditional testing model. Instead of validating code after it's committed, validation happens continuously as code is generated. Instead of reporting results in a separate dashboard, feedback comes back in the same environment where you're writing code. This ensures that all the context you need is at one place instead of you scrambling through different tools to correlate information.
The Closed Loop Pattern
Traditional testing treated validation as a gate: write code, commit, wait for the gate to open or close. Continuous validation treats it more like a conversation: generate code, trigger relevant tests automatically, receive results with full context, fix issues immediately, repeat.
Internally, this changes three things:
- Validation is orchestrated from where the code is written - IDE and not a disconnected system. So, when your AI assistant generates a new API endpoint, you trigger tests directly from your development environment.
- Tests trigger intelligently based on what part of code has changed. The system understands code relationships and executes tests accordingly - modify an authentication function and integration tests for auth flows run automatically.
- When tests fail, you get complete context in one place - your IDE. Logs, Kubernetes events, resource metrics, and historical patterns - all accessible at one place without tool-hopping.

From Sequential to Intelligent
Traditionally, workflows were sequential. You wrote code in your IDE. Commit it to GitHub. Wait for CI/CD to queue your job. Tests run in an isolated pipeline. Results appear in a dashboard. You go through the logs which is in another system. Check Kubernetes events in yet another tool. Finally understand the failure. Context-switch back to your IDE. Fix the issue. Start the cycle again.
But the continuous validation flow is interactive and iterative. Your AI assistant generates code. Relevant tests trigger automatically. Results stream back into your IDE with full observability context. Your AI assistant analyses the failure, correlates it with infrastructure events, and suggests a fix. You apply the fix. Tests run again. The loop closes in minutes, not hours, without leaving your development environment.
How Testkube MCP Server Closes the Loop
Adding another dashboard to consolidate reports from other tools isn’t the solution. The solution is to eliminate the need to jump between dashboards in the first place. This requires two things working together:
- a way for AI agents to orchestrate tests directly from your IDE, and
- a centralized system that provides complete observability context when things fail.
The Bridge: Model Context Protocol (MCP)
MCP is a standardized open protocol that allows AI agents to interact with external tools and systems. Think of it as an API that AI assistants understand natively. When your AI assistant needs to run tests, check execution status, or analyse failures, MCP translates those requests into actions the testing system can perform.
Testkube's MCP Server exposes test orchestration capabilities through this protocol. Using this your AI assistant can now trigger testworkflows, monitor execution, retrieve logs and artifacts, and access historical test data. All through natural language interaction in your IDE. No manual navigation. No context switching. Just conversation.
What Your AI Assistant Can Now Do
With Testkube MCP Server integrated into your IDE, your AI coding can:
- Run test workflows with natural language. Instead of navigating to your CI/CD system to manually trigger tests, you simply tell your AI: "Run the API integration tests for this change." The MCP Server translates that request, executes the appropriate test workflow in your Kubernetes cluster - local or remote, and streams results back.
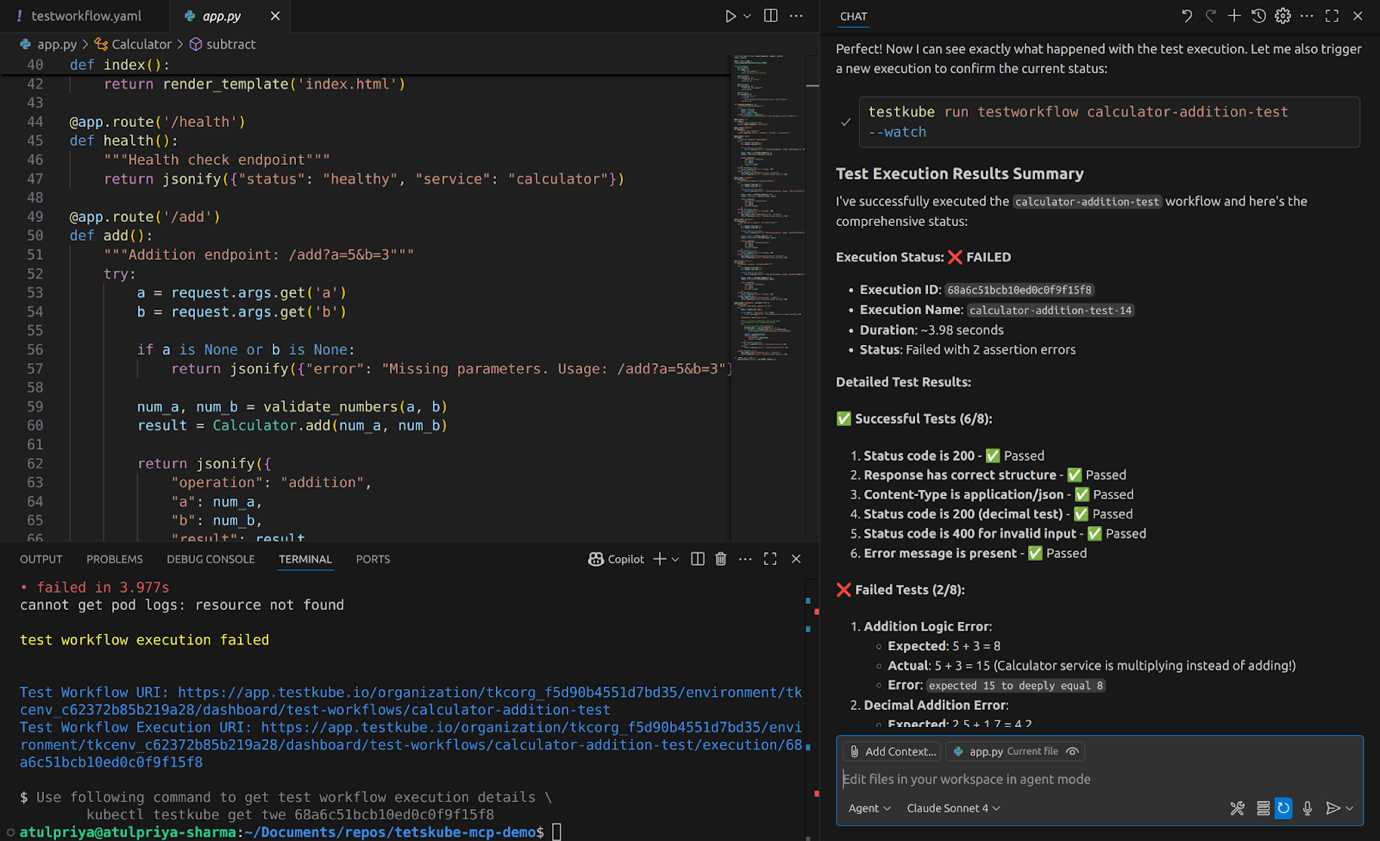
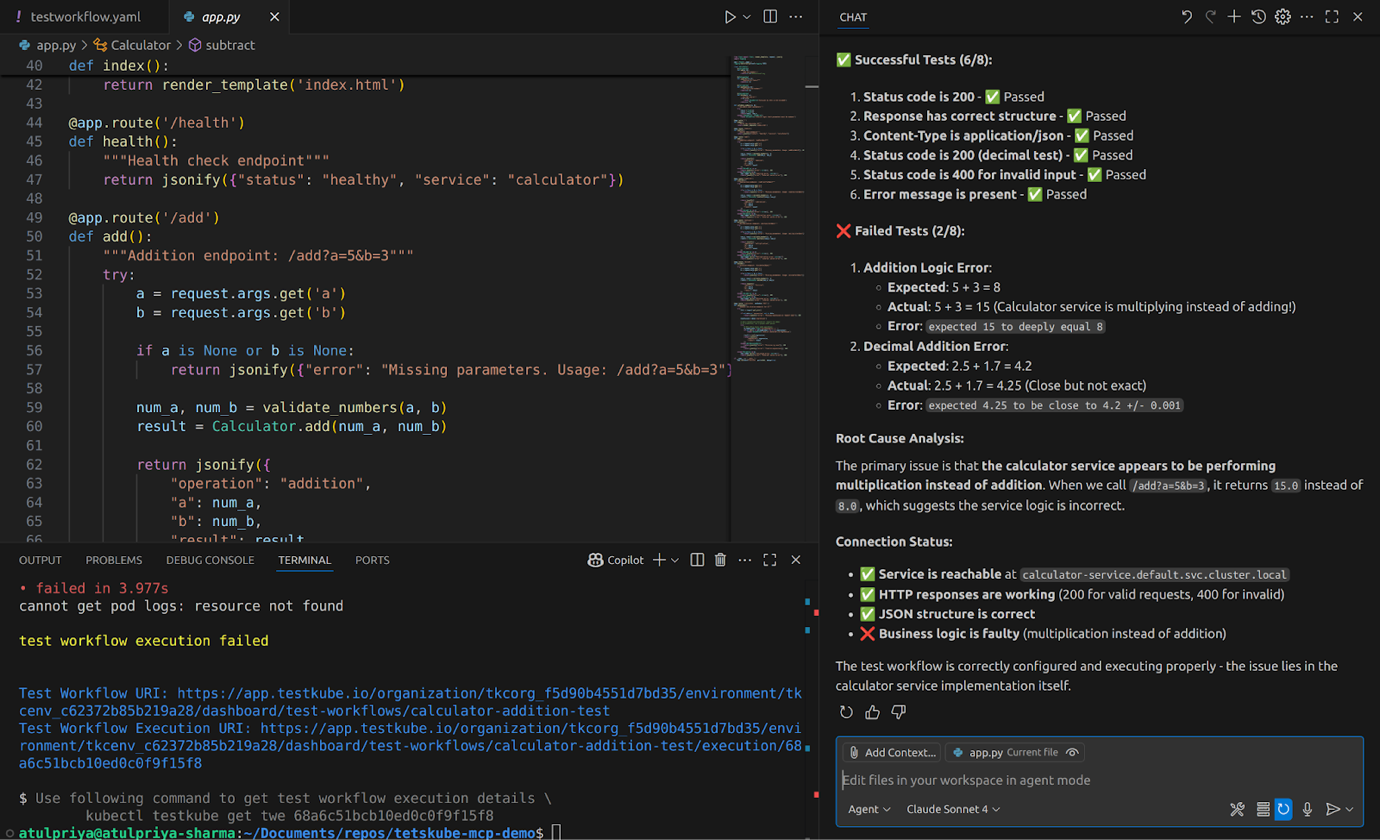
- Get comprehensive failure analysis without switching tools. When tests fail, your AI doesn't just report "test failed." It has access to the complete failure context - full logs, test artifacts, related Kubernetes events, resource consumption during the test run - and presents it coherently. No tab-switching required.
- Correlate test failures with infrastructure events automatically. Your AI can answer questions like "Did any pods restart during this test run?" or "Was there a memory spike that caused the failure?" by accessing both test results and underlying Kubernetes telemetry through the same interface.
- Compare current runs with historical patterns for faster debugging. Instead of manually searching through past test executions, your AI can identify that this failure pattern occurred three times last week, always related to a specific resource constraint, and suggest the fix that worked before. This becomes super helpful for flaky tests or regression bugs.
The Architecture
The workflow is straightforward. Your AI assistant connects to Testkube via the MCP Server. When you ask it to run tests, it communicates with Testkube's control plane, which orchestrates test execution across your Kubernetes clusters - whether that's a local cluster for rapid iteration, a staging environment, or production-like infrastructure.
Results stream back through the MCP Server to your AI assistant, which can then analyse failures, suggest fixes, or trigger additional validation - all in the same conversation where code was generated.
For local development loops, Testkube can execute tests against clusters running on your laptop, giving you fast feedback without the overhead of remote deployments.
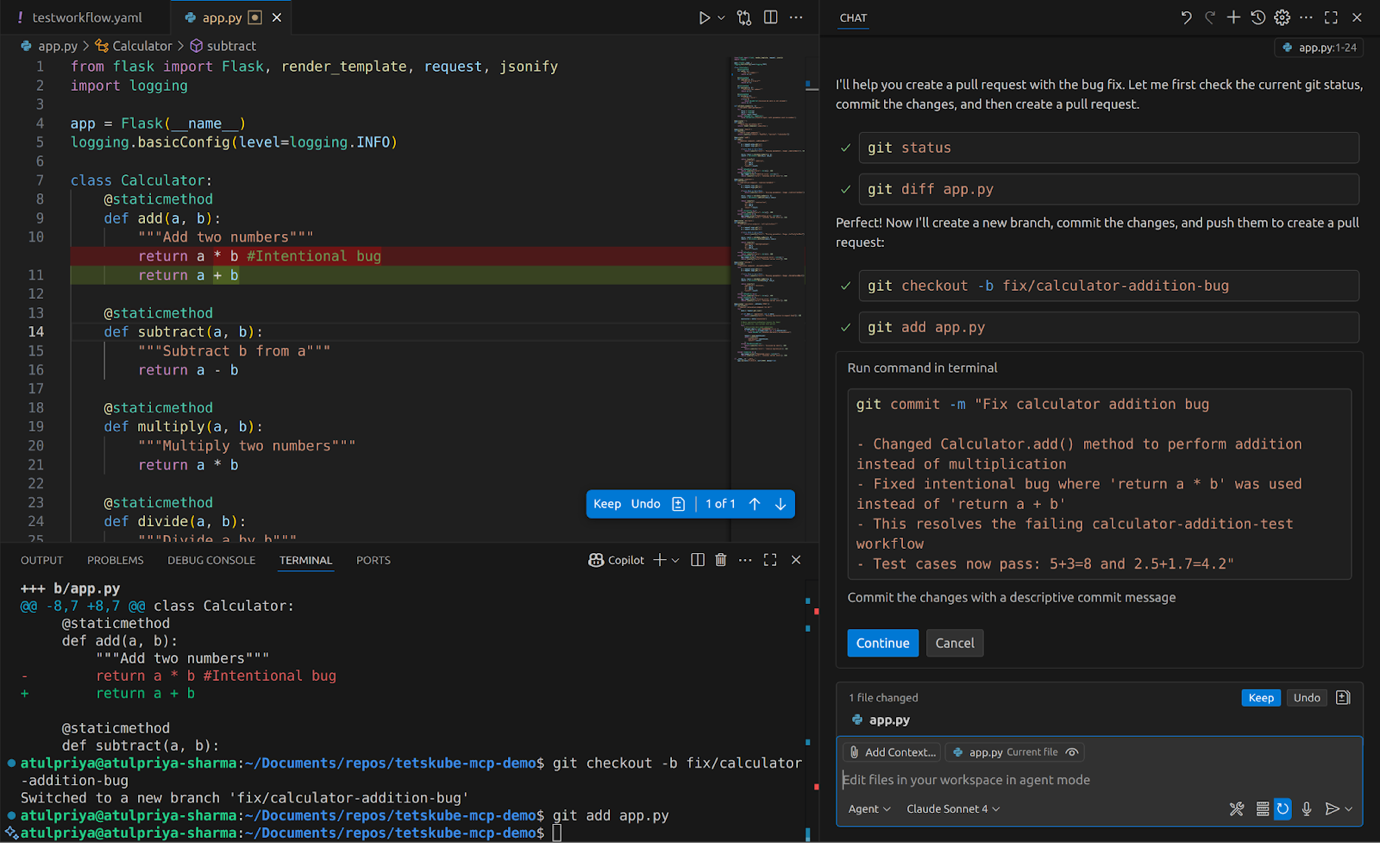
The architecture enables you to connect multiple MCP servers. Connect GitHub's MCP server alongside Testkube, and your AI can examine recent commits related to a test failure. Add a Kubernetes MCP server, and your AI can check cluster health during test execution. The more context your AI has access to, the better it can debug issues without you manually gathering information.
For a detailed walkthrough of setting up Testkube MCP Server with your AI coding environment, including configuration examples and real usage scenarios, check out our hands-on guide on AI-Powered Test Orchestration with Testkube MCP Server.
Real Validation, Real Time Savings
The difference between traditional PR validation in CI/CD pipelines isn’t just theoretical, it’s practical and the time savings are massive. Here’s a comparison.
Before and After Scenario
Let's walk through the same task using traditional CI/CD versus continuous validation with Testkube MCP Server.
The difference is evident from the table, continuous validation loops help debug issues faster with zero context switches and complete failure analysis without leaving your IDE.
What Changes at Scale
Increased PR throughput
When time for validation cycle reduces, context switching also reduces, which enables this same developer to handle more PRs that before. The bottleneck shifts from waiting and tool-hopping to actual development work. Teams don't need to hire more people to handle AI-generated code volume - their existing developers can finally move at the speed AI enables.
Test Coverage Improves
When running tests requires committing code, waiting for CI/CD, and manually debugging failures across tools, developers may skip smaller tests to allow them to push features faster. But when running tests means asking your AI assistant instead of committing code and navigating dashboards, developers test more often. No friction means no excuses to skip validation. Hence, the easier testing becomes, the more testing happens.
Post-merge issues decrease
Traditional CI/CD reports "test failed" but continuous validation explains why it failed by correlating test failures with infrastructure events, resource constraints, and recent deployments. This deeper analysis helps catch environment-specific issues, configuration problems, and edge cases that pass in CI pipelines but fail in production. Thus, when developers understand failures completely before merging, fewer bugs escape to production.
Match Validation to Velocity
AI assistants changed the way we code, but our traditional CI/CD pipelines haven’t evolved to validate at that speed. The result? Code generation accelerates 10x while validation infrastructure stays at 1x, creating a bottleneck that erases most of AI's promised productivity gains.
Continuous validation closes this gap. The closed loop pattern we discussed, eliminates the tool fragmentation that kills velocity. It leads to less friction, faster feedback and better context - all of it from the same place where your developers are coding.
And the best part? The infrastructure to make this real already exists. Testkube's MCP Server connects your AI assistant directly to test orchestration capabilities, while centralized observability ensures complete failure context without tool-hopping.
Curious to see this in action? Hook up Testkube’s MCP Server to your IDE and watch validation keep pace with your code - no more waiting, no more tool-hopping.
About Testkube
Testkube is the open testing platform for AI-driven engineering teams. It runs tests directly in your Kubernetes clusters, works with any CI/CD system, and supports every testing tool your team uses. By removing CI/CD bottlenecks, Testkube helps teams ship faster with confidence.
Get Started with a trial to see Testkube in action.