.avif)

Table of Contents
Start your free trial.
Start your free trial.

Start your free trial.

Table of Contents
Executive Summary
Your application passed every test in the CI pipeline. Then 2,000 users hit it simultaneously in production and pods started crashing. The dashboards turned red, the on-call engineer got paged, and everyone spent the next three hours figuring out that the memory limits were set too low for real traffic patterns.
This is the gap that load testing in Kubernetes is supposed to close. But running load tests inside a K8s cluster is a different problem than running them against a monolith on a VM. The cluster itself introduces variables (pod scheduling, HPA behavior, resource contention across namespaces) that don't exist in traditional load testing setups.
This guide covers how to approach Kubernetes load testing in a way that actually catches the problems you'll hit in production, which tools work best for the job, and where most teams get stuck.
Why Load Testing in Kubernetes Is Different
Traditional load testing assumes a relatively static target: a server with fixed resources running your application. Kubernetes changes the equation because the infrastructure is dynamic. Pods scale up and down. Nodes get rescheduled. Resource limits interact with load in ways that are hard to predict without actually simulating that load.
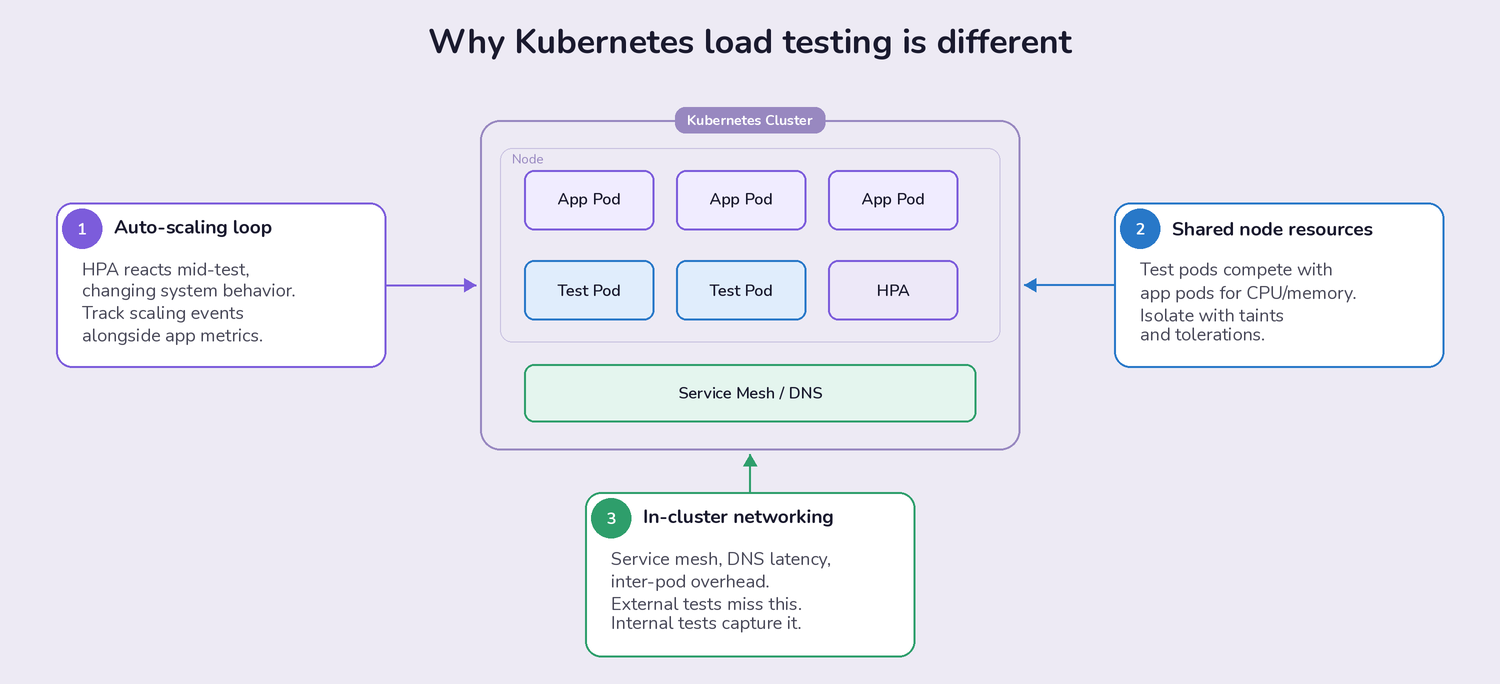
Three things make K8s load testing uniquely tricky:
- Auto-scaling introduces a feedback loop. Your Horizontal Pod Autoscaler (HPA) responds to the load your tests generate, which changes the system's behavior mid-test. If you're not monitoring HPA events alongside your application metrics, you're only seeing half the picture. The goal isn't just "does my app handle 1,000 requests per second," but "does my app handle 1,000 RPS while scaling from 3 pods to 12, and how long does that transition take?"
- Resource contention is shared. Your load test pods compete for CPU and memory on the same nodes as your application pods (unless you've specifically isolated them with taints and tolerations). A load test that consumes 4 CPU cores on a node can starve the application it's supposed to be testing. This is a real problem teams discover after their first large-scale test produces confusing results.
- Network behavior inside the cluster matters. Service mesh overhead, DNS resolution latency, and inter-pod networking all affect results. Load tests running outside the cluster hit a load balancer and miss these internal factors entirely. Tests running inside the cluster capture the actual network path your production traffic follows.
Best Practices That Actually Help
Start Small and Build a Baseline
This sounds obvious, but most teams skip it. They jump straight to "simulate 10,000 concurrent users" because that's the number their product manager is worried about. The problem is that without a baseline at 50, 100, and 500 users, you can't tell whether the failure at 10,000 is an application bottleneck, a misconfigured resource limit, or a cluster-level constraint.
A practical ramp-up approach: start with 10-50 virtual users running realistic user journeys (not just hammering a single endpoint). Record response times, error rates, CPU/memory per pod, and pod scaling events. Increase by 2-3x at each step. The step where performance degrades tells you more than the final number ever will.
Build in realistic think times between requests. A test that fires 1,000 requests per second with zero delay between them is a stress test, not a load test. Real users pause between clicks, wait for pages to render, and don't all hit your checkout endpoint at the same millisecond.
Monitor the Infrastructure, Not Just the Application
Application metrics (response time, throughput, error rate) tell you what is happening. Kubernetes infrastructure metrics tell you why.
During a load test, track these alongside your application data:
- CPU and memory usage per pod and per node. Watch for pods approaching their resource limits. A pod that hits its memory limit gets OOMKilled. A pod that hits its CPU limit gets throttled. Both produce different failure modes that look like application bugs if you're not watching the infrastructure layer.
- HPA scaling events and timing. How long does it take for new pods to become ready after the HPA triggers a scale-up? If there's a 90-second gap between the traffic spike and the new pods serving requests, that's a window where existing pods are overloaded. This is one of the most common causes of latency spikes in production K8s deployments.
- Network I/O and DNS resolution. In service-mesh environments (Istio, Linkerd), the sidecar proxy adds latency to every request. Under load, that overhead can increase non-linearly. DNS lookups for internal services can also become a bottleneck if your CoreDNS pods are under-provisioned.
- Container restart frequency. Pods restarting during a load test usually means OOMKill events or failing health checks. Both indicate that your resource requests and limits need adjustment, or that your readiness probes are too aggressive for high-load conditions.
Use Tools That Understand Kubernetes
Generic load testing tools (JMeter running on a laptop, for example) can generate traffic, but they don't know anything about the Kubernetes environment they're targeting. You lose visibility into the cluster-side behavior, and you spend time writing glue scripts to deploy, scale, and collect results from test runners.
Kubernetes-native load testing tools solve this by running as pods inside the cluster, using K8s operators or Helm charts for deployment, and integrating with the Kubernetes API for scaling and monitoring. The difference isn't just convenience; it's accuracy. Tests running inside the cluster produce results that reflect actual production conditions.
Load Testing Tools That Work Well in Kubernetes
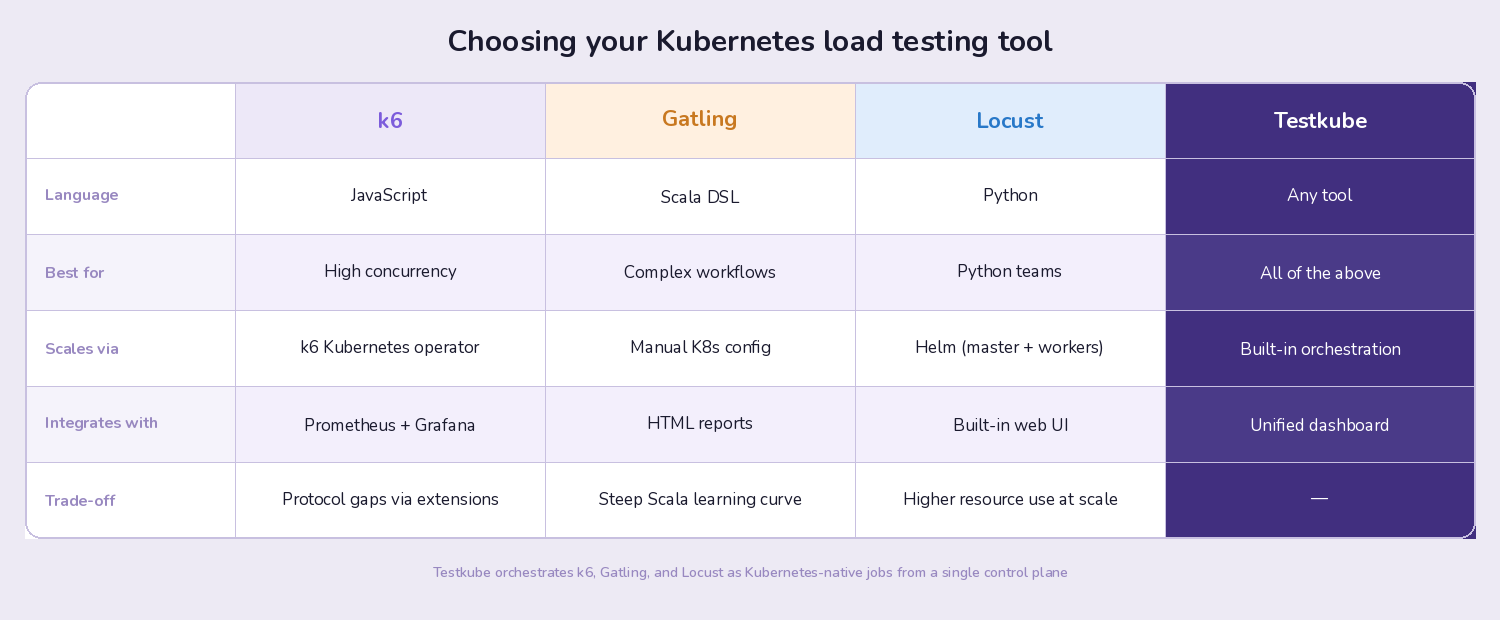
k6: The Developer-Friendly Option
k6 has become the default choice for many K8s teams, and for good reason. Tests are written in JavaScript, which lowers the barrier for developers who aren't performance testing specialists. The k6 Kubernetes operator handles distributed test execution across multiple pods, so scaling from 100 to 100,000 virtual users is a configuration change rather than an infrastructure project.
What makes k6 particularly useful in Kubernetes environments: it produces structured metrics output that integrates with Prometheus and Grafana, which are already running in most K8s clusters. You get load test results in the same dashboards where you monitor your application and infrastructure metrics, which makes correlation between "what the test did" and "how the cluster responded" much easier.
The trade-off: k6 doesn't support every protocol out of the box (though extensions cover most gaps), and very complex test scenarios can get verbose in JavaScript compared to Gatling's Scala DSL.
Getting started: Our k6 Kubernetes tutorial walks through setting up distributed k6 load tests with Testkube as the orchestration layer.
Gatling: When You Need Detailed Simulation
Gatling uses a Scala-based DSL that excels at modeling complex user behaviors. If your load test needs to simulate multi-step workflows (login, browse, add to cart, checkout, with realistic pauses between each step), Gatling's scenario builder is more expressive than most alternatives.
Gatling's reporting is also notably detailed. The HTML reports break down response times by percentile, show request distribution over time, and make it straightforward to identify which specific endpoints degraded under load. For teams that need to present performance results to stakeholders or include them in release sign-off processes, this reporting is valuable.
The trade-off: Scala isn't widely known among developers and QA engineers, which creates a steeper onboarding curve. Gatling also requires more configuration to run distributed tests in Kubernetes compared to k6's native operator approach.
Locust: Python-Native Distributed Testing
Locust is the natural choice for teams with strong Python experience. Test scenarios are plain Python classes, which means you can use any Python library in your load tests (useful for complex data generation, database seeding, or custom authentication flows).
Locust's web UI provides real-time monitoring during test execution, and its distributed architecture maps well to Kubernetes. You deploy one master pod and multiple worker pods via Helm, and scaling workers is as simple as adjusting the replica count.
The trade-off: Locust's per-user concurrency model (each simulated user is a Python greenlet) means it uses more resources per virtual user than k6's event-loop model. For very high concurrency tests (100,000+ virtual users), k6 is typically more resource-efficient.
Where Teams Get Stuck (and How to Fix It)
Problem: Managing Multiple Load Testing Tools
Most teams don't standardize on a single load testing tool. The backend team uses k6. The QA team prefers Gatling. Someone wrote a custom Python script for a specific integration test. Each tool has its own deployment process, its own way of collecting results, and its own dashboards.
The result: fragmented visibility. You can't compare results across tools, you can't trigger all your load tests from a single pipeline step, and debugging requires hopping between three different UIs.
This is the specific problem that a test orchestration layer solves. Rather than managing each tool independently, you define test workflows that can run any tool, collect results in a single dashboard, and trigger execution from your CI/CD pipeline, a schedule, or a Kubernetes event.
Problem: Load Tests That Block the Pipeline
Long-running load tests (30 minutes, an hour, sometimes longer) don't belong in your CI/CD pipeline. They block deployments, eat up CI runner minutes, and create pressure to skip tests when teams need to ship quickly.
The better approach: decouple load tests from the CI pipeline entirely. Trigger them as Kubernetes-native jobs that run in your cluster on their own schedule or in response to deployment events. The pipeline can check for the latest load test results without waiting for a new test to finish, and you can run extended soak tests overnight without blocking anyone.
Problem: No Historical Comparison
A single load test result is nearly useless in isolation. "P99 latency was 450ms" means nothing unless you know whether that's better or worse than last week, last month, or the release before the one you're testing.
Teams that get real value from load testing track results over time. They set performance budgets (P99 latency must stay under 500ms for this endpoint), and they flag regressions automatically. This turns load testing from a one-off activity into a continuous quality gate.
How Testkube Fits Into Kubernetes Load Testing
Testkube is a test orchestration platform built for Kubernetes. It doesn't replace your load testing tools; it runs them inside your cluster and gives you a single place to manage execution, collect results, and track performance over time.
Here's what that looks like in practice for load testing:
Run any load testing tool as a Kubernetes-native job. k6, Gatling, Locust, or custom scripts all run as pods in your cluster. Testkube handles the deployment, resource allocation, and cleanup. You define test workflows once and trigger them from anywhere: your CI/CD pipeline, a cron schedule, or the Testkube dashboard.
Parallelize test execution across pods. Instead of running a 60-minute load test sequentially, Testkube distributes the work across multiple pods. Teams using this approach have cut test execution time by up to 75%, which makes it practical to run comprehensive load tests as part of the regular release cycle rather than as a once-a-quarter event.
Unified results across tools. If your backend team runs k6 and your QA team runs Gatling, both sets of results appear in the same Testkube dashboard. You get historical trending, regression detection, and a single view of test health across your entire organization. No more checking three different tools to answer "are we ready to release?"
CI/CD integration without pipeline coupling. Testkube integrates with GitHub Actions, GitLab CI, Jenkins, Argo CD, and other CI/CD tools. But the tests themselves run in your Kubernetes cluster, not in CI runner containers. This means your CI pipeline stays fast while your load tests run with full access to the cluster environment.
Getting Started
If you're setting up Kubernetes load testing for the first time, here's a practical sequence:
- Pick one tool and get it running in your cluster first. k6 with the Kubernetes operator is the fastest path for most teams. Don't try to standardize three tools simultaneously.
- Build a baseline test for your most critical endpoint. Start with 50 virtual users, realistic think times, and a 5-minute duration. Record the results. This is your reference point for everything that follows.
- Add infrastructure monitoring to your test runs. Make sure you can see pod CPU/memory, HPA events, and network metrics alongside your load test results. Without this, you're guessing at root causes.
- Automate and schedule. Move the test into your CI/CD pipeline or set up a recurring schedule. The value of load testing compounds over time as you build a history of results to compare against.
- Expand tool coverage and centralize orchestration. As your testing needs grow (different tools for different test types, distributed execution, cross-team visibility), a test orchestration platform like Testkube removes the glue-script overhead and keeps everything in one place.
Have questions about Kubernetes load testing? Join the Testkube Slack community or check out the k6 Kubernetes tutorial to get hands-on.
About Testkube
Testkube is the open testing platform for AI-driven engineering teams. It runs tests directly in your Kubernetes clusters, works with any CI/CD system, and supports every testing tool your team uses. By removing CI/CD bottlenecks, Testkube helps teams ship faster with confidence.
Get Started with a trial to see Testkube in action.