Table of Contents
Start your free trial.
Start your free trial.

Start your free trial.


Table of Contents
Executive Summary
Whenever a test fails, the first reaction is often to rerun it. If it passes, we move on. This is the most common response to flaky tests, and it is also the most expensive one.
Intermittent failures trigger manual investigation loops. Engineers cross-reference logs, re-run executions, and chase environment issues that may or may not exist. At scale, this is toil that compounds until teams stop investigating altogether and just re-run.
The problem is not that your team is careless. It is that there is no execution telemetry, which means there are no signals to act on. At most, you will have some pass/fail stats with timestamps and a few logs, and that is it.
If you took this to an SRE, they would never accept an unreliable, invisible system like that in production. This post makes the case that test systems deserve the same treatment, and shows what the test observability layer looks like once you start building it.
What flaky tests actually cost
There is a specific moment when flakiness becomes a reliability problem rather than an inconvenience. It is when engineers stop trusting the test suite, and that is a gradual process.
An unexplained failure gets re-run and forgotten. A blocked pipeline gets overridden. A test that has been failing intermittently picks up a mental asterisk, "this one is always like this," and by the time an actual regression hits, the signal is already buried in noise.
This leads to slower deployments and pipelines blocked by failed tests. MTTR climbs as teams spend investigation time on test failures before confirming whether there is a real production issue. And quality gates quietly stop doing their job.
These issues trace back to the same missing layer: observability on test execution. Production systems have dashboards, alerts, and traces. Test systems have a pass/fail result and a timestamp. That information gap is what makes flakiness expensive: not the intermittent failure itself, but the inability to tell it apart from something that actually matters.
Tests are workloads: observe them like one
Whether it is a test failure or an infrastructure failure, both look the same on a CI dashboard: red. Both block the pipeline, and both require debugging.
The problem is that the two need completely different responses. A test failure means a developer needs to revisit the code. An infrastructure failure means an SRE needs to look at the cluster. When you cannot tell which one you are dealing with, you often end up with both teams looking at the wrong thing.
And yet test infrastructure rarely has the same observability built in that any other system would. Tests consume real resources, depend on network conditions, and are affected by whatever else is happening in the environment at that moment. None of that context makes it into the failure report.
What you get is a pass/fail status and a timestamp. What would actually help is knowing what resources were consumed, whether execution time stayed within the normal range, and whether the failure pattern is consistent or intermittent.
This is an instrumentation problem, not a testing problem, and the fix is the one SREs apply everywhere else: surface what is actually happening inside the thing that is failing. Without it, every flaky test is an uninvestigated incident.
The signal layer: what test observability captures
The difference between a flaky test you investigate and one you re-run is usually signal. With the right execution data, patterns emerge: a test that fails every time a specific node is under pressure, an execution that spikes memory before timing out, a test workflow whose pass rate looks fine but whose flip rate shows it alternating results every other run.
Testkube surfaces this through three layers, and it captures all three natively. None of them replaces the test result; each one gives the test result the context it never had.
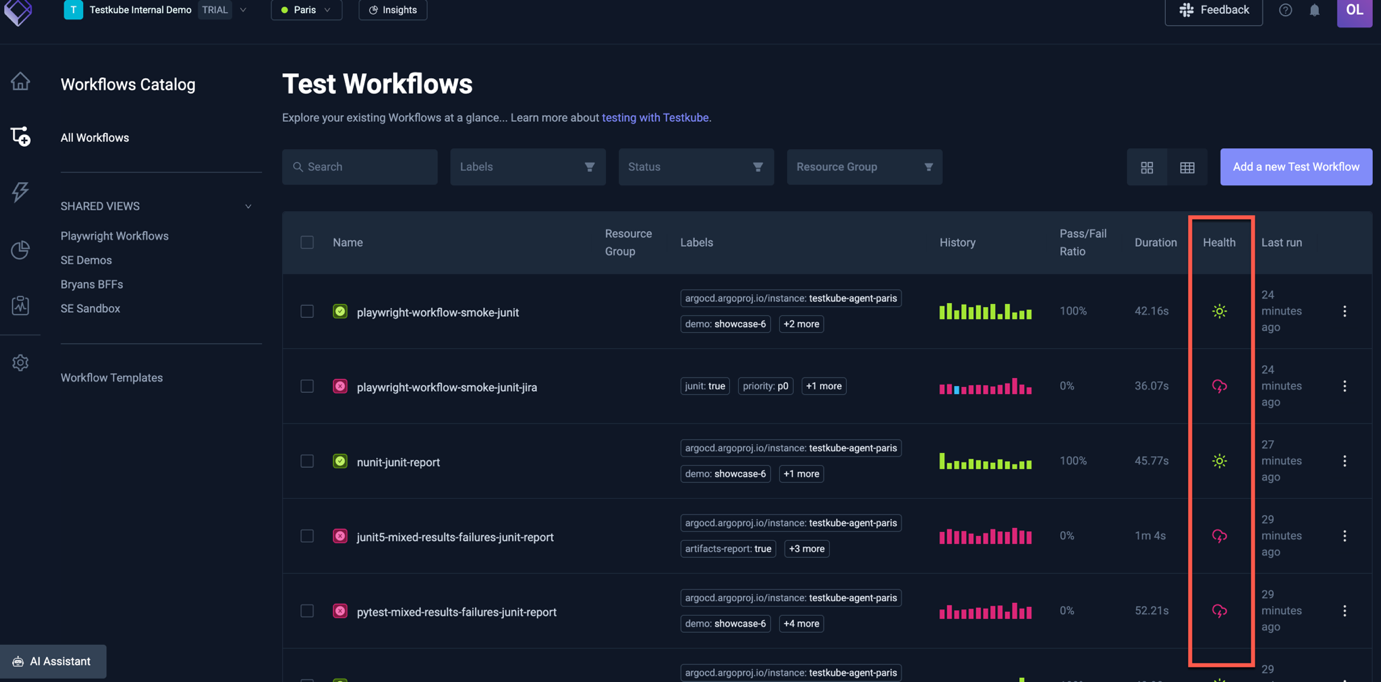
Workflow Health scores
Workflow Health scores track both pass rate and flip rate, combined into a single metric: PASS_RATE × (1 - FLIP_RATE). A high pass rate paired with a high flip rate still produces a low health score, which is exactly the signal that catches tests that look reliable while being structurally unstable.
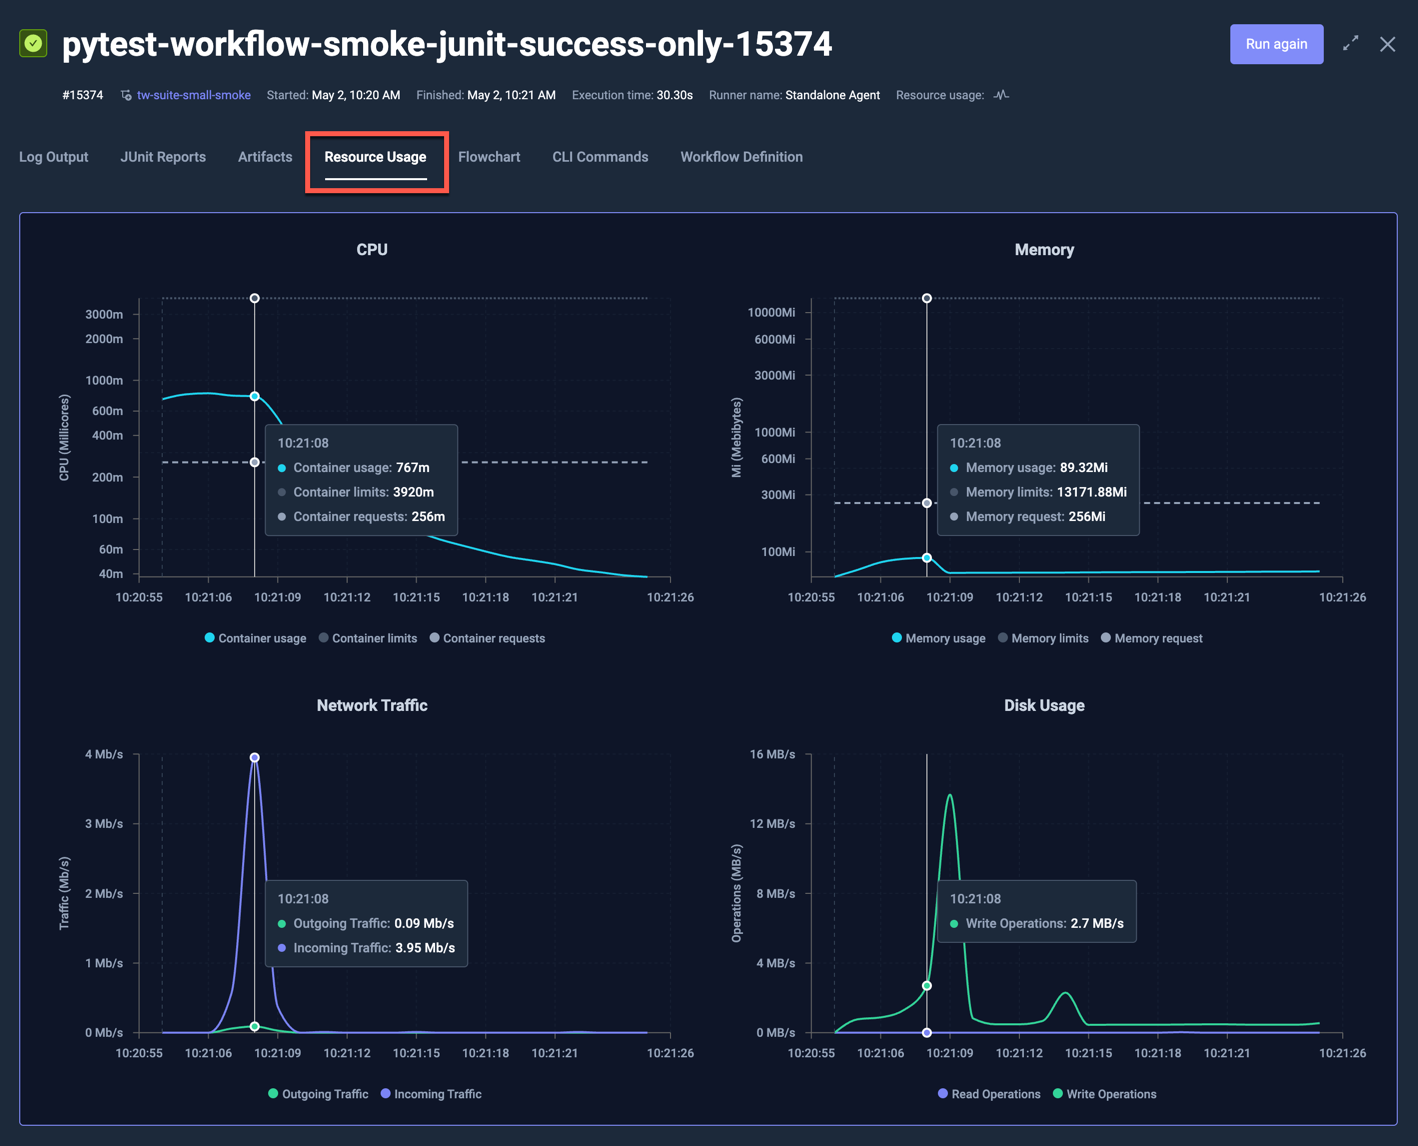
Resource metrics
Resource metrics go a level deeper: CPU, memory, network, and disk IO per execution step, with aggregates across runs. When a test fails under memory pressure, you will see it here before you see it anywhere else.
Test Insights and the Efficiency Quadrant
Test Insights rounds out the picture with execution trends and an Efficiency Quadrant, frequency versus duration, that makes optimization candidates obvious rather than something you have to hunt for.
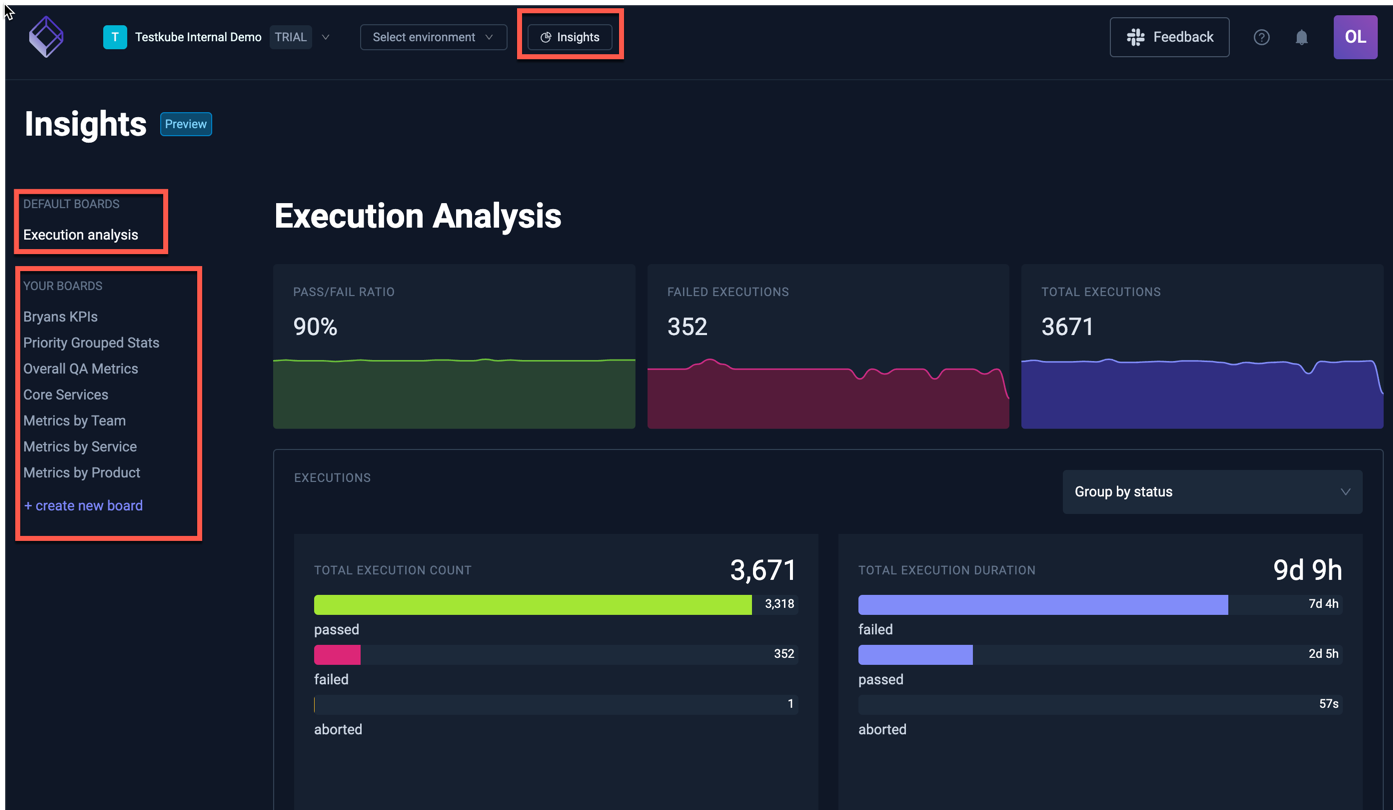
That is what it looks like to treat test execution as an observable system.
Where AI agents close the loop
The signals Testkube captures are only useful if someone, or something, acts on them. Cross-referencing test results against cluster state by hand is complex, slow, and error-prone. The hardest part is not fixing the failure; it is knowing who should fix it. Is this a code problem for a developer, or an infrastructure problem for an SRE?
These situations call for AI to separate the issues and correlate reports into one complete picture. A handful of generic AI agents can help, but you want specialized testing agents that are purpose-built and carry the full context.
This is where Testkube AI agents come in. You can also build dedicated agents for advanced test orchestration and analysis, using both internal and external MCP servers for whatever scenario you need.
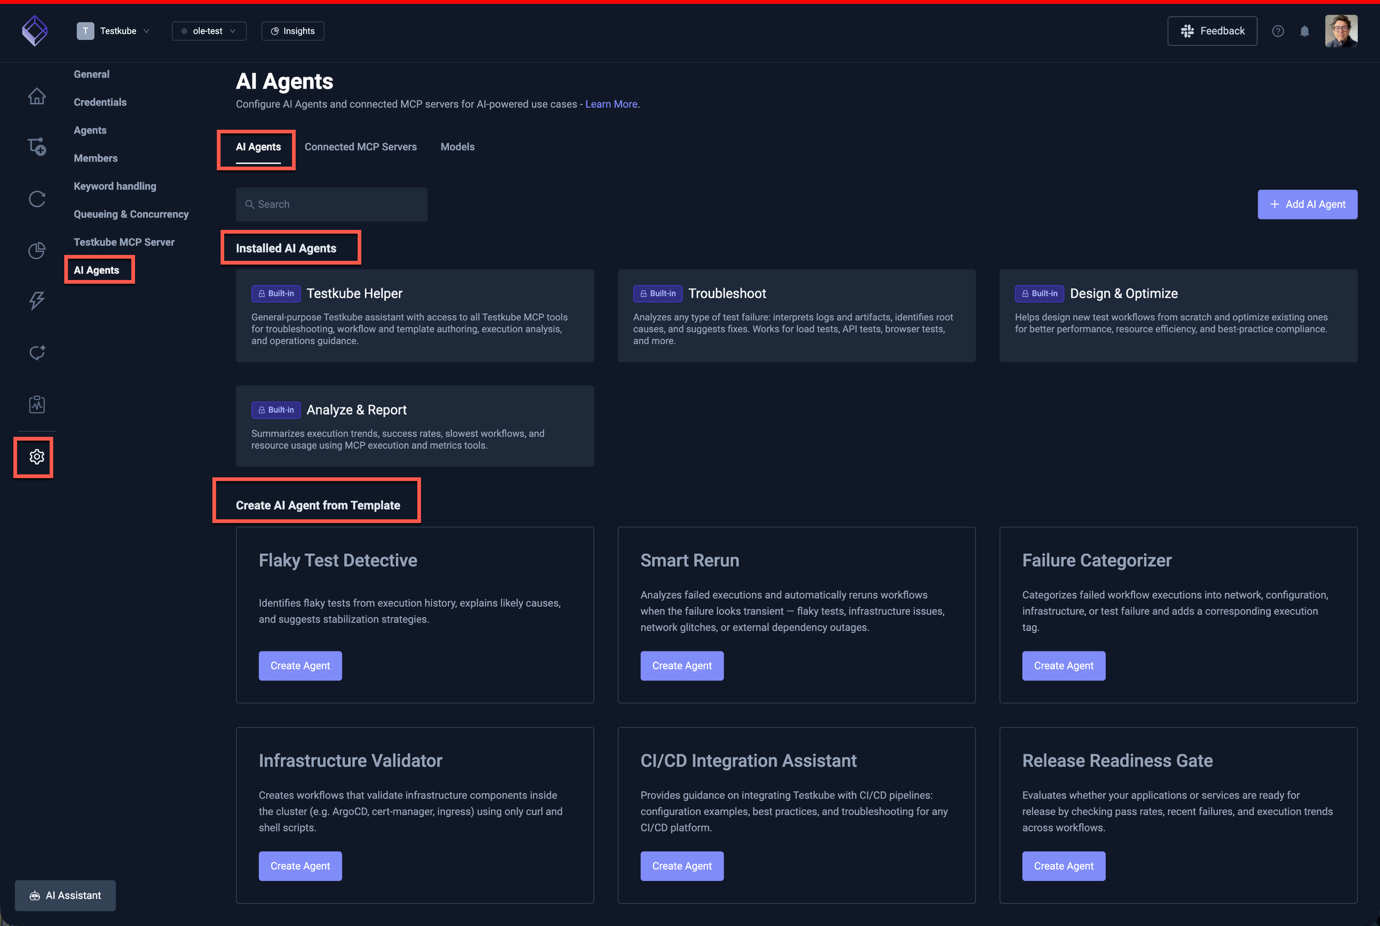
Two out-of-the-box agents help directly with test flakiness.
Infrastructure Triage Agent
The Infrastructure Triage Agent looks at each failure and makes the call engineers currently make by hand: is this an infrastructure problem or a code problem? A failure caused by an OOM kill or a scheduling timeout is classified as infrastructure and surfaced to the SRE. A failure that traces to a code regression goes to the developer. One automatic classification step removes the ambiguity that sends both teams chasing the wrong failure.
Incident Correlator
The Incident Correlator handles the cases where failures do not arrive alone. Multiple workflows failing in the same window often share a root cause: a node under pressure, a resource quota hit, a flapping network path. The agent groups them, identifies the common factor, and surfaces one event instead of ten.
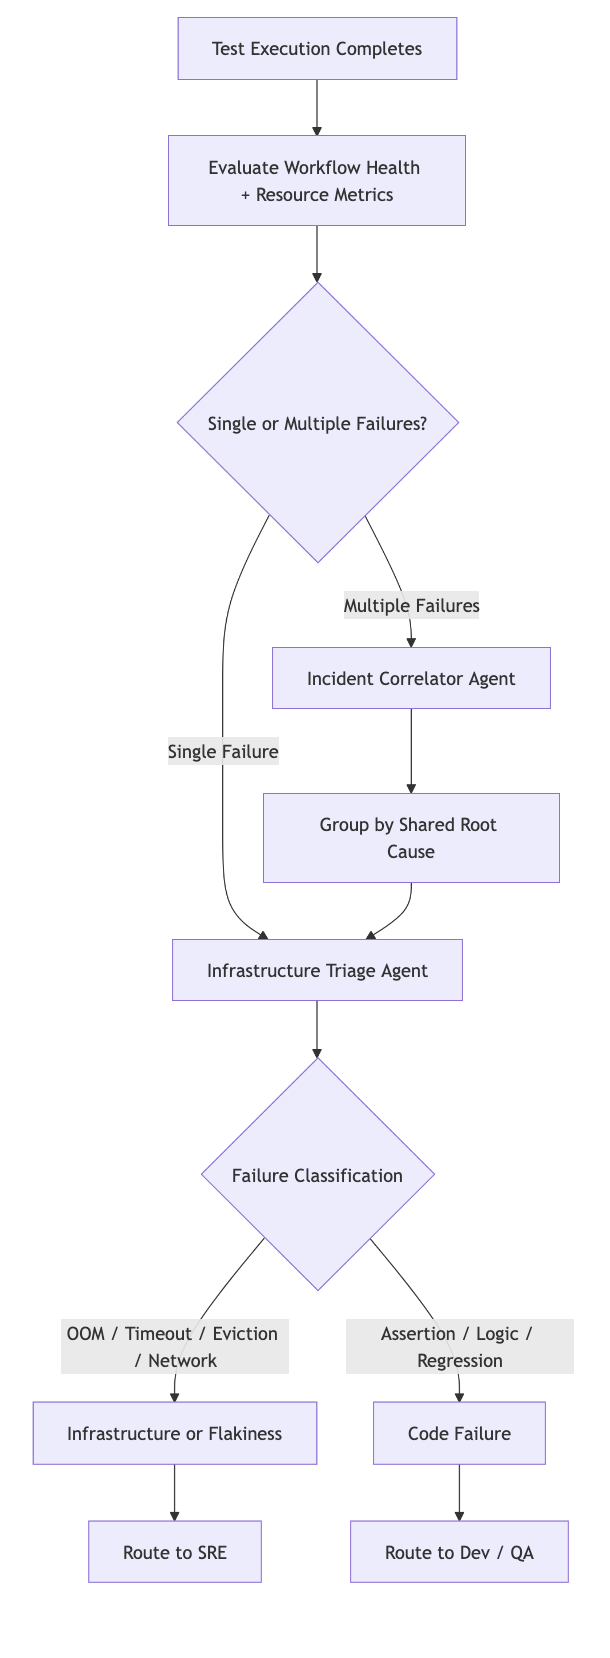
You can also connect either agent to external MCP servers, Kubernetes for pod events and node conditions, or Grafana and Prometheus for infrastructure metrics, and the triage gets richer. Agents can query resource state during the exact execution window, not just after the fact.
Here is how that pipeline looks.
Reliability you can act on, not chase
Production systems have SLOs because reliability carries an operational cost. Test systems carry the same cost, in blocked pipelines, eroded trust, and toil at scale, but they rarely get the same treatment.
The shift starts with instrumentation. When test execution is observable, flakiness stops being a gut feeling and becomes a signal. When that signal feeds automated triage, reliability becomes something you act on systematically rather than chase one re-run at a time.
Testkube's execution telemetry and AI agents give you that layer natively, inside your Kubernetes environment. To see it in action, explore the sandbox or talk to the team about bringing it into your stack.
Key takeaways
- Re-running flaky tests is the default response and the most expensive one. The real cost is the toil and lost trust that compound every time a failure goes uninvestigated.
- Flakiness is expensive because of missing signal, not the failure itself. Without execution telemetry, you cannot tell an intermittent failure apart from a real regression.
- Tests are workloads, so observe them like one. Test failures and infrastructure failures look identical on a CI dashboard but need completely different responses.
- Three signals turn flakiness into data: Workflow Health, resource metrics, and Test Insights. Together they give a pass/fail result the context it never had.
- AI agents close the loop by routing failures automatically. Infrastructure Triage and the Incident Correlator decide whether a failure belongs to an SRE or a developer, and group related failures into one event.
Frequently asked questions
About Testkube
Testkube is the open testing platform for AI-driven engineering teams. It runs tests directly in your Kubernetes clusters, works with any CI/CD system, and supports every testing tool your team uses. By removing CI/CD bottlenecks, Testkube helps teams ship faster with confidence.
Get Started with a trial to see Testkube in action.