.avif)

Table of Contents
Start your free trial.
Unlock Better Testing Workflows in Kubernetes — Try Testkube for Free

Unlock Better Testing Workflows in Kubernetes — Try Testkube for Free


Table of Contents
Executive Summary
Trace-based testing is a sophisticated methodology that leverages real-time analysis and monitoring of application traces to uncover potential issues, identify bottlenecks, and optimize performance. By capturing and analyzing trace data generated during an application's runtime, developers gain valuable insights into its behavior, enabling them to identify and rectify hidden problems before they impact end-users.
In this blog post, we’ll introduce you to Tracetest, an open-source trace-based testing tool based on OpenTelemetry that allows you to leverage trace data to write e2e and integration tests, and improve assertion capabilities, and how to unlock Testkube's capacity in conjunction with it, leveraging the work you have already done to instrument your services.
What is Testkube? Testkube is a test execution and orchestration framework for Kubernetes that works with any CI/CD system and testing tool you need, empowering teams to deliver on the promise of agile, efficient, and comprehensive testing programs by leveraging all the capabilities of Kubernetes to eliminate CI/CD bottlenecks, perfecting your testing workflow.
By using the Testkube Tracetest Executor you can now add Tracetest to the native CI/CD pipeline in your Kubernetes cluster. This allows you to add all the additional Testkube functionalities, like running scheduled test runs and using Test Triggers. All while following the trace-based testing principle and enabling full in-depth assertions against trace data, not just the response.
In this tutorial, I’ll show you how you can get started running Tracetest within your CI/CD pipeline.
—
To run trace-based tests with Tracetest and Testkube, make sure you have these three things installed before starting.
Initial Setup
Start by installing the Testkube CLI by signing into Testkube or following these instructions for your operating system. By default, Testkube is installed in the testkube namespace.
Install Tracetest
Tracetest is open-source and easy to install. Start by installing the Tracetest CLI by following these instructions for your operating system. By default, Tracetest is installed in the tracetest namespace.
To explore the Tracetest Web UI, run the command:
kubectl --kubeconfig ${HOME}/.kube/config --context kind-kind --namespace tracetest port-forward svc/traCreate a Test in Tracetest
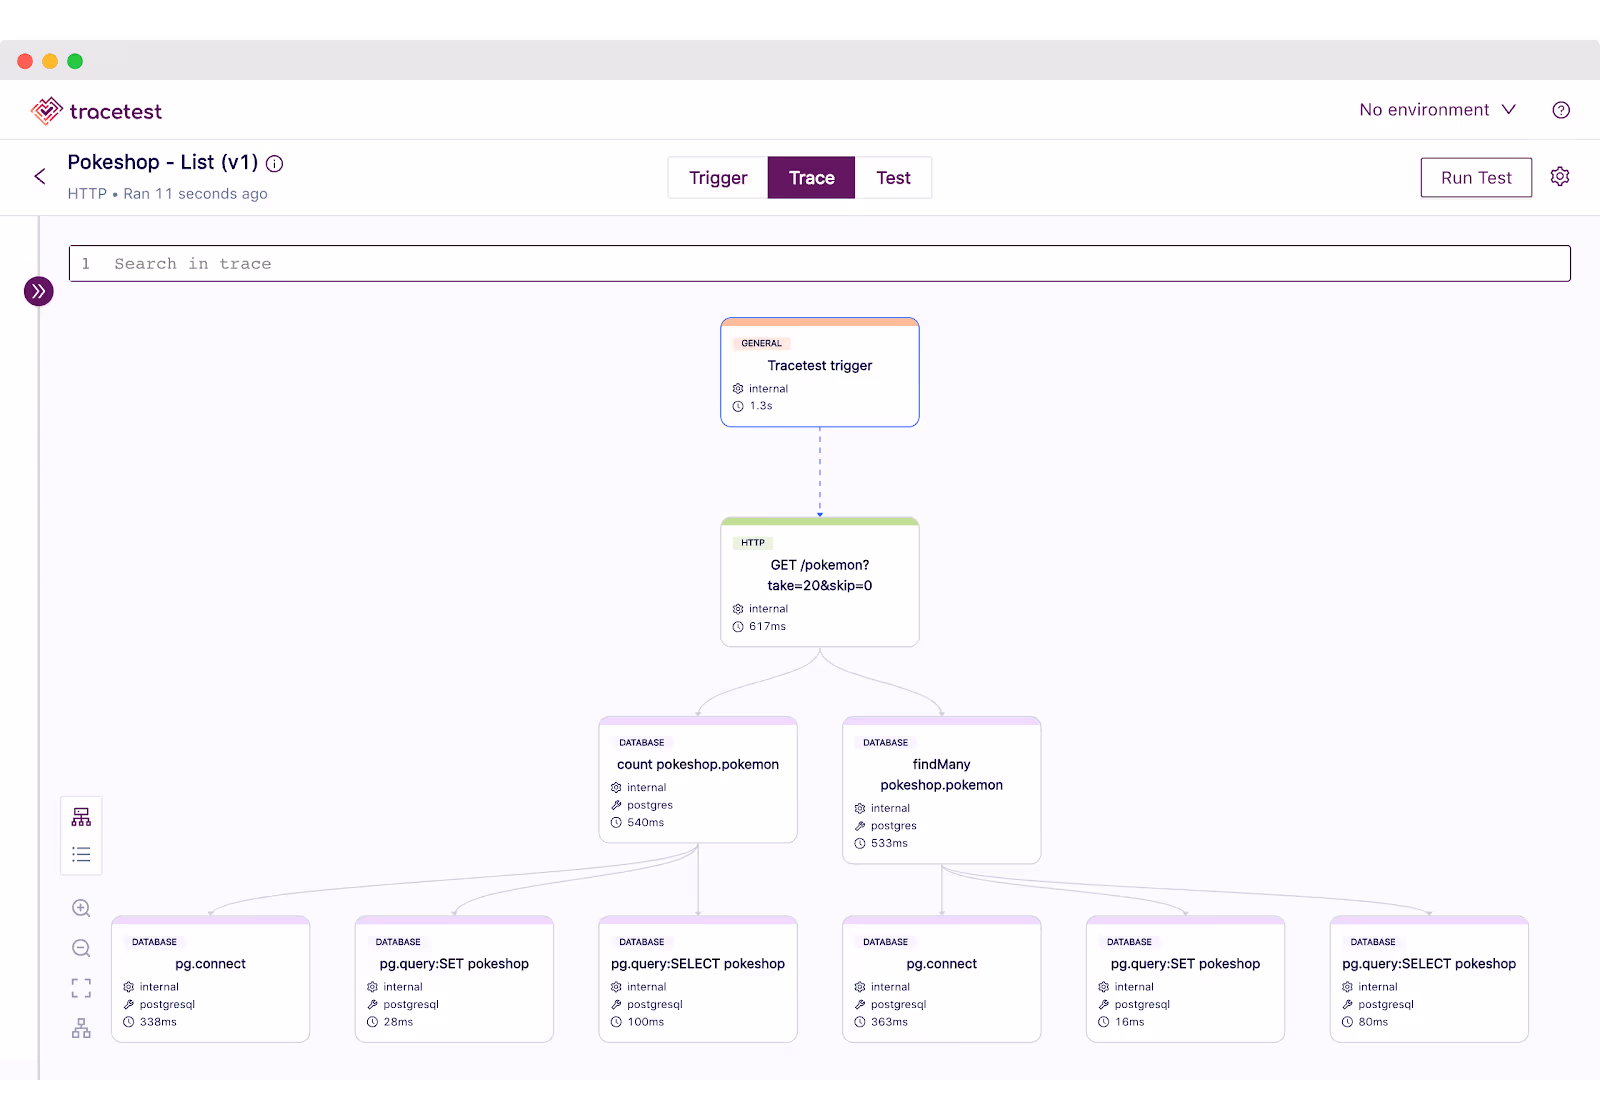
Start by clicking Create > Create New Test > HTTP Request > Next > Choose Example (dropdown) > Pokeshop - List (generates a sample test from the Tracetest demo) > Next > URL is prefilled with http://demo-pokemon-api.demo/pokemon?take=20&skip=0 > Create and Run.
This will trigger the test and display a distributed trace in the Trace tab to run assertions against:
Let's add a test spec to assert that all the database queries return within 500 ms. Click the Test tab and proceed to click the Add Test Spec button.
In the span selector make sure to add this selector:
span[tracetest.span.type="database"]In the assertion field add:
attr:tracetest.span.duration < 500msSave the test spec and publish the test:
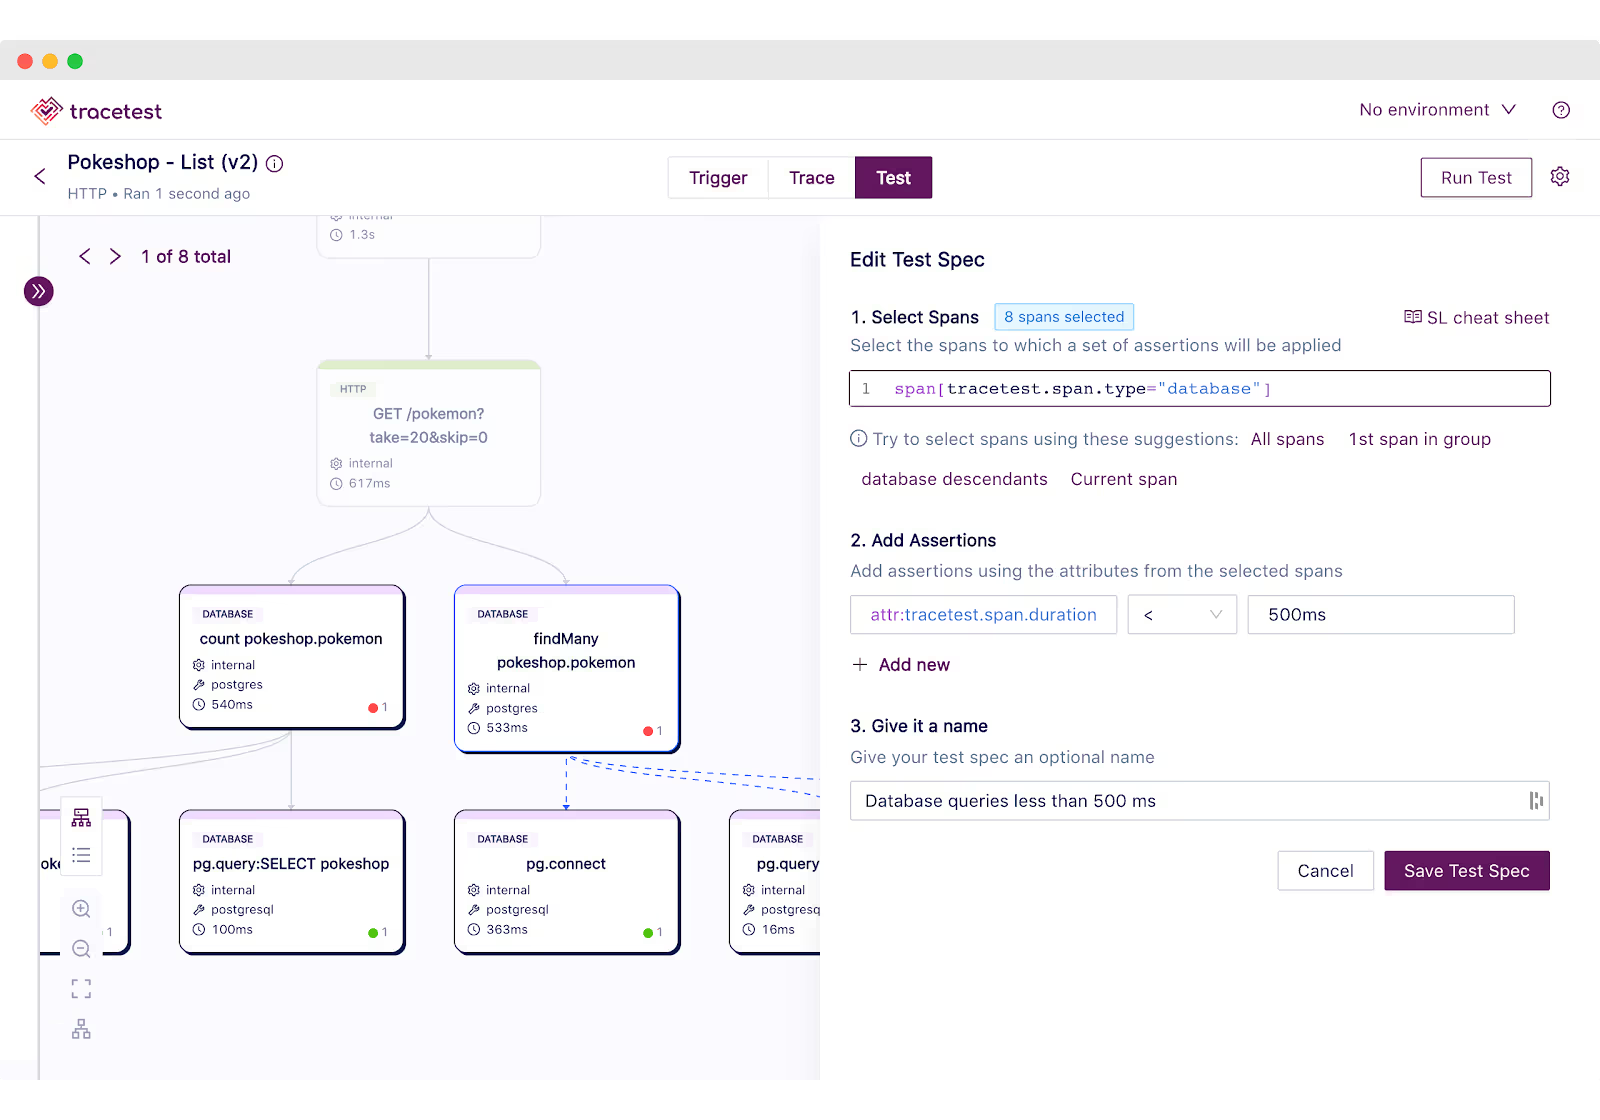
The database spans that are returning in more than 500ms are labeled in red.

This is an example of a trace-based test that asserts against every single part of an HTTP transaction, including all interactions with the database.
However, Tracetest cannot run this test as part of your CI/CD without integrating it with another tool.
Let's introduce how Testkube makes it possible.
Trigger a Trace-based Test in Tracetest with Testkube
To add your Tracetest tests to Testkube, use the create test command. You'll need to reference the .yaml file for your test definitions using the --file argument and the Tracetest Server endpoint using the --variable argument with TRACETEST_ENDPOINT.
Your Tracetest Endpoint should be reachable by Testkube in your cluster. Use your Tracetest service's CLUSTER-IP:PORT, for example: 10.96.93.106:11633.
kubectl testkube create test --file ./test.yaml --type "tracetest/test" --name tracetest-test --variable TRACETEST_ENDPOINT=http://CLUSTER-IP:PORTIn the Tracetest Web UI, click the ⚙️ button in the top right. Then click Test Definition.
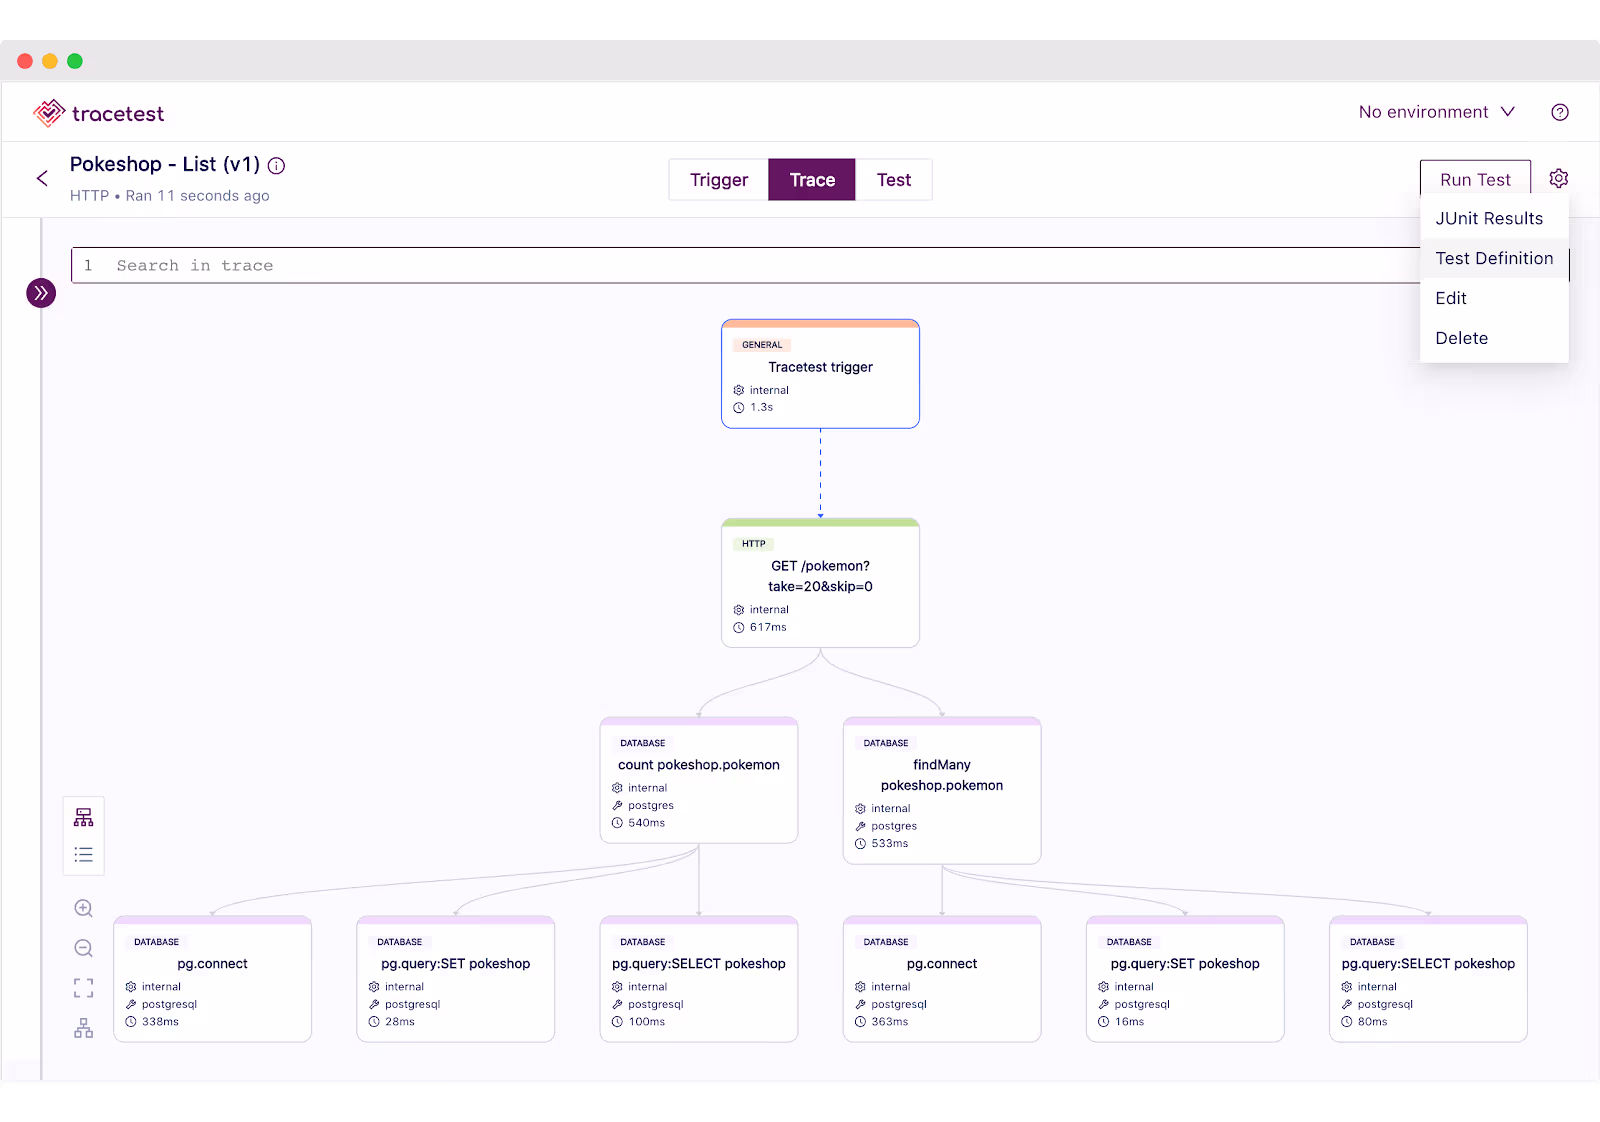
This will open a YAML definition for the test run:

Save this into a file and name it test.yaml. It will look something like this:
type: Test
spec:
id: RUkKQ_aVR
name: Pokeshop - List
description: Get a Pokemon
trigger:
type: http
httpRequest:
url: http://demo-pokemon-api.demo/pokemon?take=20&amp;skip=0
method: GET
headers:
- key: Content-Type
value: application/json
specs:
- name: Database queries less than 500 ms
selector: span[tracetest.span.type="database"]
assertions:
- attr:tracetest.span.duration < 500msExecute the following command to create the test object in Testkube. Do not forget to provide the path to your Tracetest definition file using the --file argument, and also the Tracetest server endpoint using the TRACETEST_ENDPOINT --variable.
Remember that your TRACETEST_ENDPOINT should be reachable from Testkube in your cluster. Use your Tracetest service's CLUSTER-IP:PORT. E.g: 10.96.93.106:11633.
Enter the following command to create your test:
kubectl testkube create test --file ./test.yaml --type "tracetest/test" --name pokeshop-tracetest-test --variable TRACETEST_ENDPOINT=http://CLUSTER-IP:PORTTrigger the Testkube Dashboard and you'll see the test has been created successfully!
testkube dashboard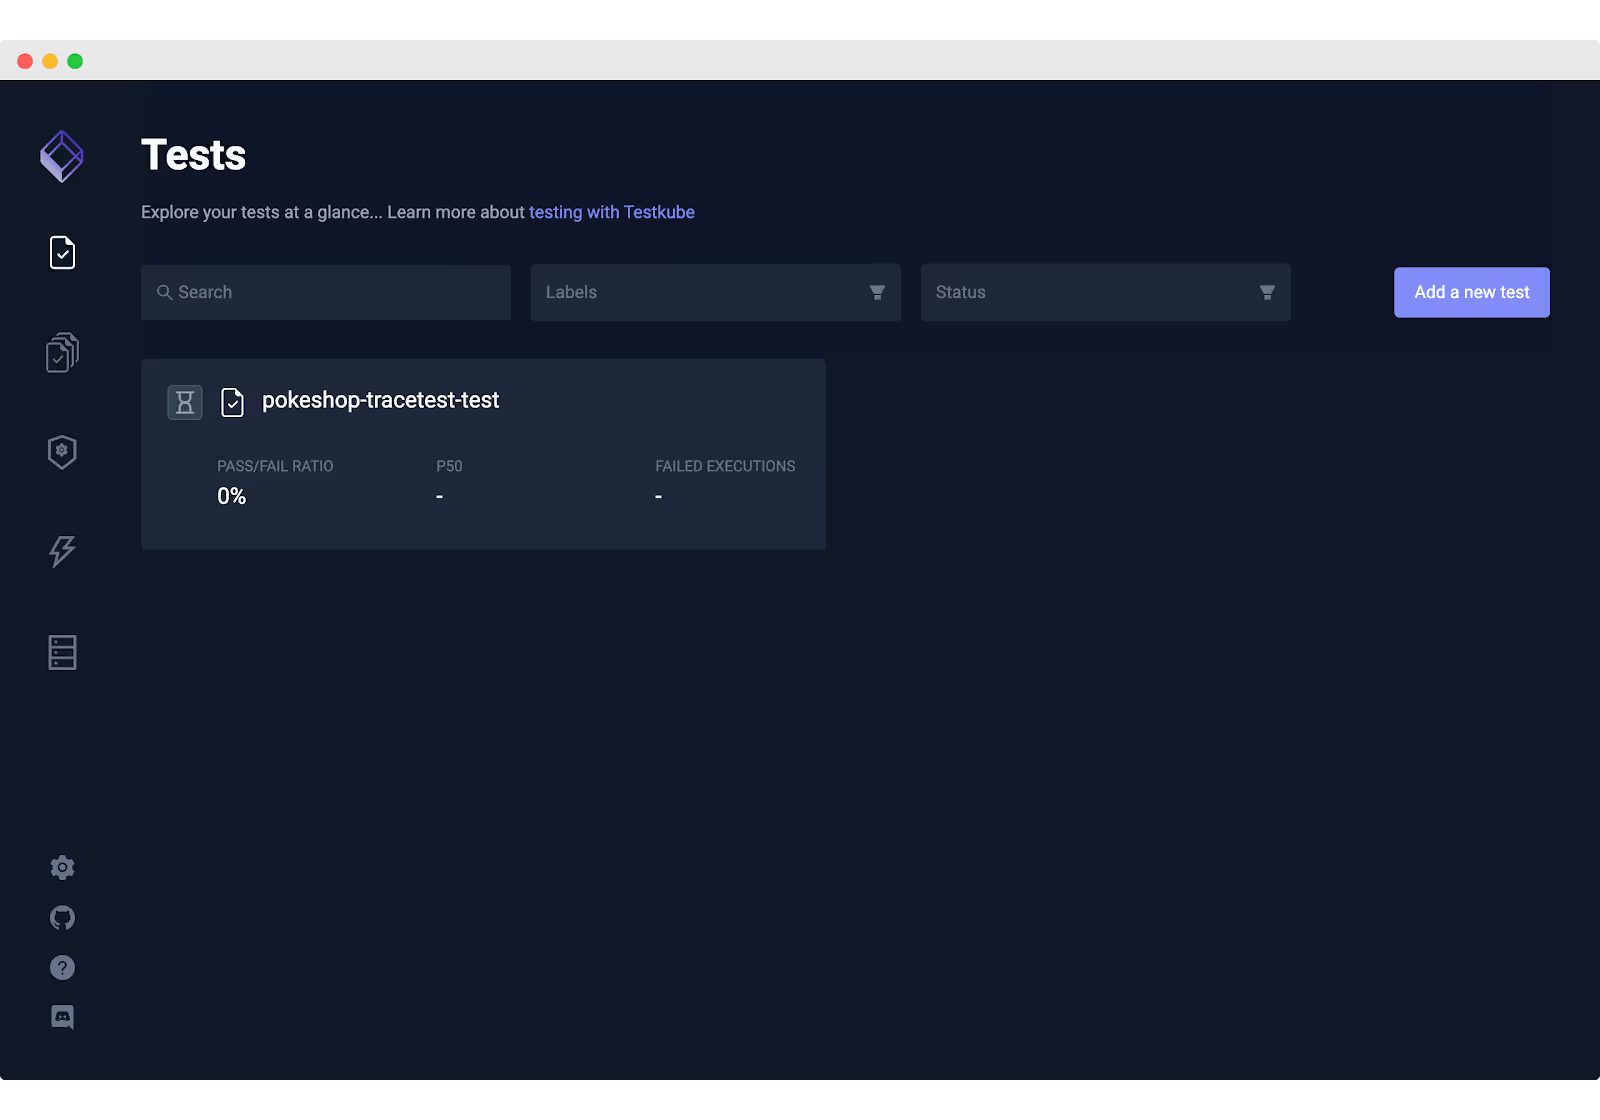
Finally, to run the test, execute the following command:
kubectl testkube run test --watch pokeshop-tracetest-testAnd done! Our test will start its execution. You can see the logs directly from your terminal or through Testkube's Dashboard:
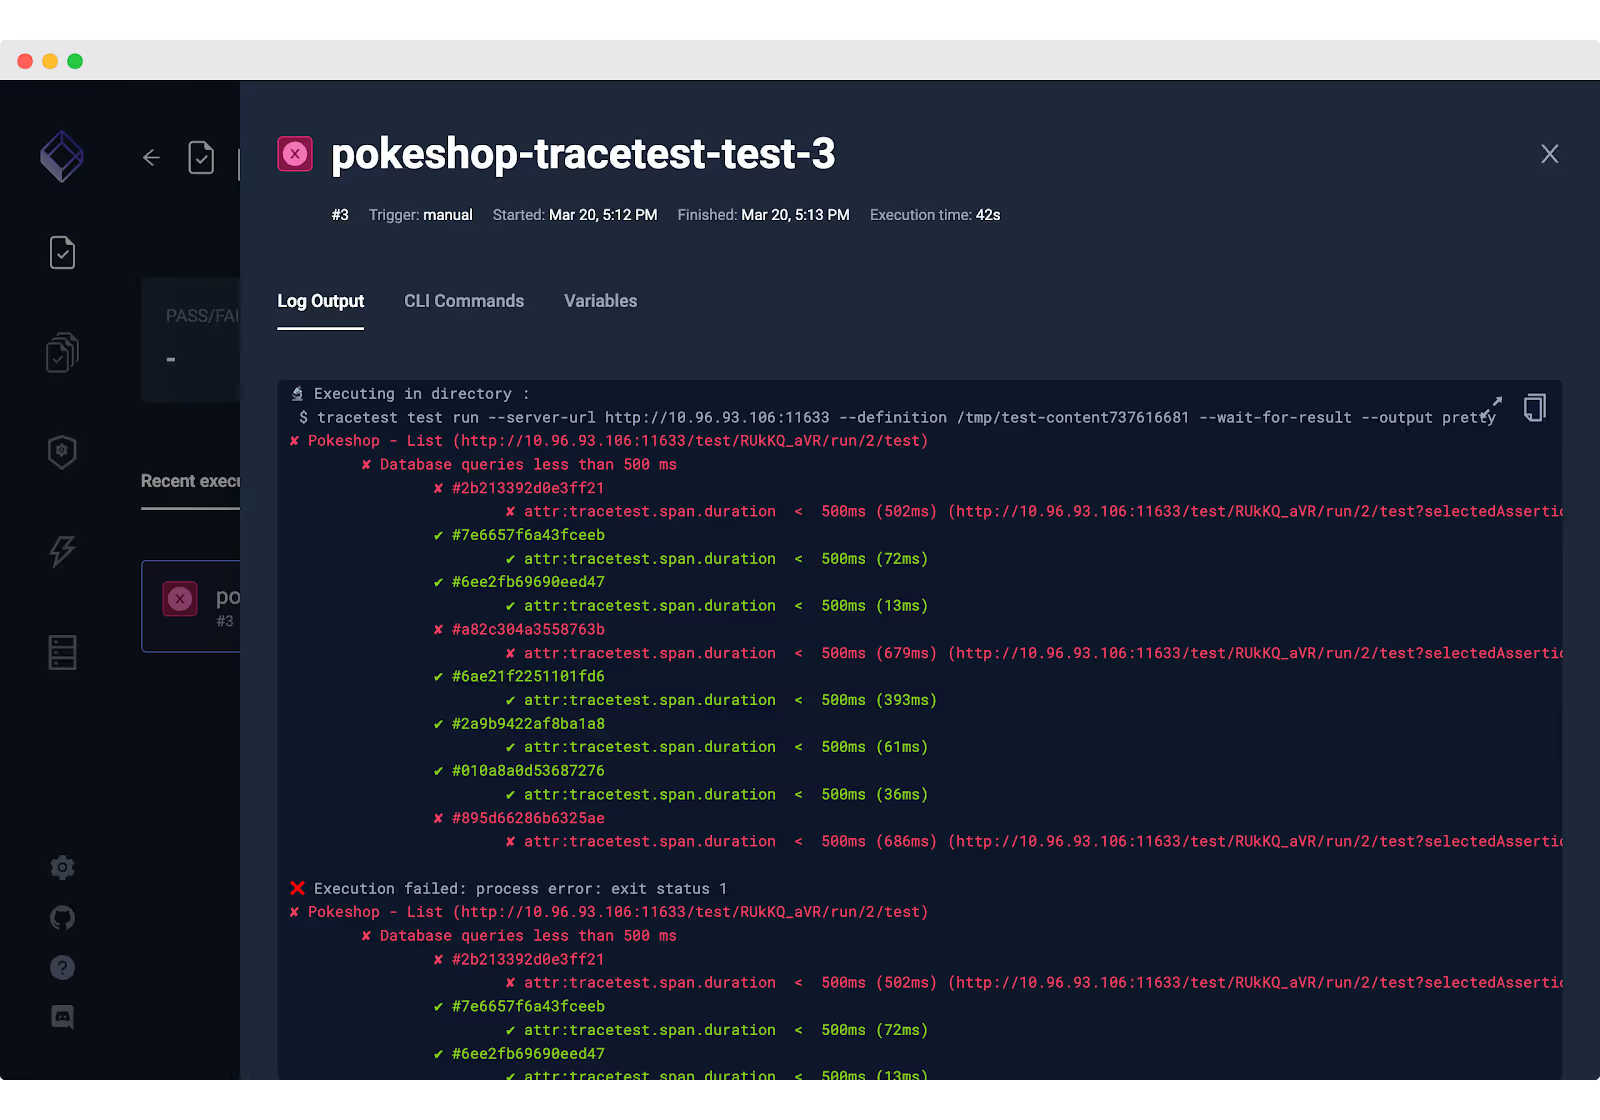
If the test passes, you'll see the following output:
Execution completed
🔬 Executing in directory :
$ tracetest test run --server-url http://10.96.93.106:11633 --definition /tmp/test-content1901459587 --wait-for-result --output pretty
✔ Pokeshop - List (http://10.96.93.106:11633/test/RUkKQ_aVR/run/3/test)
✔ Database queries less than 500 ms
✅ Execution succeeded
Execution completed ✔ Pokeshop - List (http://10.96.93.106:11633/test/RUkKQ_aVR/run/3/test)
✔ Database queries less than 500 ms
Get started with trace-based testing in Kubernetes
That's it! We hope this tutorial helps you get started with Trace-based testing in Kubernetes using OpenTelemetry tracing. Combining the power of Tracetest and Testkube can open up new possibilities for optimizing our application performance and reliability - so, why not give it a try yourself?
Sign up to Testkube and try one of our examples or head over to the Tracetest documentation. If you get stuck or have questions, we are here to help! Reach out to us on Slack. And we are eager to hear how you use our integrations. :-)
About Testkube
Testkube is the open testing platform for AI-driven engineering teams. It runs tests directly in your Kubernetes clusters, works with any CI/CD system, and supports every testing tool your team uses. By removing CI/CD bottlenecks, Testkube helps teams ship faster with confidence.
Get Started with a trial to see Testkube in action.