Table of Contents
Start your free trial.
Start your free trial.

Start your free trial.


Table of Contents
Executive Summary
"Deployment succeeded" is one of the most misleading signals in Kubernetes.
It means your pods have started and readiness probes have passed the checks. It however, does not mean your infrastructure is healthy, your storage is correctly attached, or your ingress is routing traffic as expected.
Kubernetes is excellent at maintaining declared state. That's the reconciliation loop - pods restart, replicas self-heal, resources converge toward what you defined. But reconciling state and validating that state is operationally healthy are two different things. That gap between 'the cluster looks like what I declared' and 'the cluster is actually behaving correctly' - is where incidents quietly begin.
The gap isn't a single problem. It's four distinct failure points in the cluster lifecycle:
- provisioning - did anyone validate the infrastructure before workloads landed on it?
- drift - is what's running today actually what you think is running?
- dependencies - are the services your pods rely on genuinely ready, not just reachable? and
- post-upgrade - did the cluster upgrade introduce anything that broke quietly?
Each of these is a point where infrastructure state gets assumed, not proven. Testkube give you a Kubernetes-native way to prove it instead – Test Workflows are repeatable, version-controlled, and triggerable at every relevant point in your cluster's lifecycle. Read our post on Infrastructures testing in Kubernetes that covers the foundations.
In this post, we’ll walk through what validating every layer of your Kubernetes infrastructure looks like, with real scenarios and reusable workflows that you can apply.
The gaps nobody is watching
Every Kubernetes cluster goes through the same lifecycle: it gets built, workloads land, things change, and components get upgraded. At each stage, teams make a reasonable but risky assumption - that because the last step succeeded, the current state is correct.
Below are the four stages, each with its own failure signature.
- Provisioning: The cluster is up, nodes are ready, and workloads start deploying. But has anyone actually validated that the storage classes are configured correctly, that PVCs can bind, or that the node topology supports the workloads you're about to run? Usually not. The assumption is that if provisioning tooling is completed without errors, the infrastructure is ready, which often is wrong.
- Drift: This gap is slower and quieter. A replica gets scaled down manually to debug something and is never scaled back up. A resource quota gets hit and nobody notices because the affected namespace isn't in production yet. A ConfigMap gets edited directly on the cluster, bypassing GitOps. What's running today is not what was declared last week, and nothing flagged the divergence.
- Dependency: This one produces the most misleading dashboards. Your application pods are healthy - liveness probes passing, restarts at zero. But the PostgreSQL instance they depend on is refusing new connections because it's hit its max connection limit. The ingress backend for one route is returning 503s. The cache layer is unreachable. The app layer looks fine; the infrastructure beneath it isn't.
- Post-upgrade: Upgrades are the highest-risk and least-validated moment in a cluster's lifecycle. The control plane upgrade completes cleanly. The ingress controller rolls to the new version. No alerts fire, but routing behaviour changed subtly. A deprecated annotation stopped working, or a storage driver now expects a different mount configuration. The cluster looks healthy but something quietly broke.
What "validating every layer" actually means
Infrastructure validation isn't a single check that you run once. It's a set of targeted, distinct checks across every layer of your cluster. Each one asks a different question about a different part of the system - is my computeris my compute healthy and correctly sized? Is my storage attached and readable? Is my networking routing traffic as expected? Are my dependencies actually ready?
- Compute: This is where most teams start, and where most teams stop. Pod health, restart counts, crash loops, OOM kills, resource pressure on nodes - these are the visible symptoms of infrastructure problems. But compute validation isn't just about whether pods are running. It also means verifying that the nodes your workloads need are actually available and correctly configured - for example ensuring you have the right accelerators present for teams deploying AI or GPU workloads.
- Storage: This is the silent one. A PVC can show as Bound and still be unreadable. A StatefulSet replica can come back after a node replacement with its persistent identity intact but its volume pointing at the wrong place. Validating storage means checking PV attachment, confirming PVC binding is healthy, and verifying that each StatefulSet replica has the volume it expects - not just that a volume exists.
- Networking: This requires end-to-end validation and not just pod status checks. Ingress availability, backend route resolution, TLS termination, service-to-service reachability - these all need active validation, not passive monitoring. A route that returned 200 before an upgrade can silently return 502 after it, with no alert firing because the ingress pod is still running.
- Dependencies: This is the invisible layer. Your health check probes pass. But the PostgreSQL instance is at max connections, the Redis cache is unreachable from a specific namespace, the external API your service calls has changed its contract. Dependency validation extends infrastructure checks beyond the pod boundary and moves into the services and systems your infrastructure relies on to actually function.
- AI and GPU workloads: These introduce a validation layer most teams don't think about until a workload fails to schedule. Validating that GPU nodes are present, that the right drivers and operators are installed, and that CUDA workloads can actually run on the target node pool is as critical as any other infrastructure check. Mainly because it's entirely invisible to standard health probes.
Test Workflows are the mechanism that makes all of this repeatable. Each check becomes a version-controlled, schedulable, Kubernetes-native workflow - something you can run on demand, trigger after a deployment, or schedule as a cron job across every layer of your cluster.
Real scenarios, real workflows
Every gap discussed in the previous sections has a workflow equivalent - a specific check you can run, schedule, or trigger that would have surfaced the problem before it became an incident.
Here are three examples, grounded in scenarios that are more common than most teams would like to admit.
Scenario 1: The pod that was "running" but wasn't
A deployment shows 3/3 replicas running. There are no alerts or complaints from the team. What nobody noticed was that one pod had been OOM-killed and restarted 23 times in the last hour. The pod kept coming back, so Kubernetes kept marking it healthy. The restart count was sitting there in plain sight, but nobody was watching it systematically.
The `pod-health-check` workflow checks pod phases and restart counts across any namespace you point it at. If a pod's restart count exceeds your defined threshold, the workflow fails and surfaces exactly which pods are the problem.
spec:
  config:
    target_namespaces:
      type: string
      default: "default"
      description: "Comma-separated namespaces to validate"
    max_restarts:
      type: string
      default: "10"
      description: "Maximum allowed restart count per pod"
  steps:
    - name: "Validate Pod Health"
      run:
        image: docker.io/library/alpine:3.20
        env:
          - name: TARGET_NAMESPACES
            value: "{{ config.target_namespaces }}"
          - name: MAX_RESTARTS
            value: "{{ config.max_restarts }}"
        shell: |
          # Flag pods in unexpected phases
          bad_phase="$(kubectl get pods -n "$ns_trimmed" --no-headers \
            | awk '$3!="Running" && $3!="Completed" && $3!="Succeeded" {print $1, $3}')"

          # Flag pods exceeding restart threshold
          restart_violations="$(kubectl get pods -n "$ns_trimmed" --no-headers \
            | awk -v max="$MAX_RESTARTS" '$4+0 > max {print $1, "restarts=" $4}')"
Scenario 2: The volume that came back wrong
A node in the cluster was replaced during a maintenance window. The StatefulSet recovered and all replicas returned to Running. What the team missed was that one replica's PVC was no longer mounted by any pod. The volume existed, showed as Bound, but the pod that should have been using it wasn't. Data writes were silently failing for that replica.
The `pv-attachment-check` workflow validates that every PVC in a namespace is actually mounted by at least one running pod.
spec:
  config:
    target_namespaces:
      type: string
      default: "default"
      description: "Comma-separated namespaces to validate"
  steps:
    - name: "Validate PV Attachments"
      run:
        image: docker.io/library/alpine:3.20
        shell: |
          # Get all PVCs in namespace
          pvc_names="$(kubectl get pvc -n "$ns_trimmed" \
            -o custom-columns=NAME:.metadata.name --no-headers)"

          # Get all volumes mounted across pods
          pod_volumes="$(kubectl get pods -n "$ns_trimmed" \
            -o jsonpath='{range .items[*]}{.metadata.name}{"|"}\
            {range .spec.volumes[*]}{.persistentVolumeClaim.claimName}{","}\
            {end}{"\n"}{end}')"

          # Flag any PVC not mounted by a pod
          for pvc in $pvc_names; do
            if ! echo "$pod_volumes" | grep -q "|.*$pvc,"; then
              echo "FAIL: $ns_trimmed/$pvc is not mounted by any pod"
              failed=1
            fi
          done
Scenario 3: The route that broke silently after an upgrade
An ingress controller was upgraded as part of a routine cluster maintenance window. Everything looked healthy, but three days later, a support ticket came in: one backend route was returning 502s. The upgrade had introduced a subtle change in how backend service endpoints were resolved, and the affected service had no ready endpoints registered. The ingress was technically healthy. The traffic was not going anywhere useful.
The `ingress-health-check` workflow validates that every backend service defined in your ingress rules has at least one ready endpoint. No ready endpoints mean the route is broken, regardless of what the ingress pod's status says.
spec:
  config:
    target_namespaces:
      type: string
      default: "default"
      description: "Comma-separated namespaces to validate"
  steps:
    - name: "Validate Ingress Health"
      run:
        image: docker.io/library/alpine:3.20
        shell: |
          # Get all ingress backend services
          services="$(kubectl get ingress "$ing" -n "$ns_trimmed" \
            -o jsonpath='{range .spec.rules[*].http.paths[*]}\
            {.backend.service.name}{"\n"}{end}' | awk 'NF')"

          # Validate each backend has ready endpoints
          for svc in $services; do
            endpoints="$(kubectl get endpoints "$svc" -n "$ns_trimmed" \
              -o jsonpath='{.subsets[*].addresses[*].ip}')"
            if [ -z "$endpoints" ]; then
              echo "FAIL: Service $ns_trimmed/$svc has no ready endpoints"
              failed=1
            fi
          done
None of these workflows require instrumentation changes, new agents, or external services. They run where your infrastructure lives, against the actual state of your cluster.
Introducing the Testkube Workflow Marketplace
The three workflows above solve three specific problems. But infrastructure validation doesn't stop there - every cluster has databases to validate, message brokers to check, caching layers to verify, and storage configurations that need regular attention. Writing a workflow for every component from scratch isn't realistic.
That's the problem the Testkube Workflow Marketplace is built to solve. It's a community-maintained library of ready-to-use Test Workflows covering the infrastructure components teams actually run - PostgreSQL, Redis, Kafka, MinIO, NGINX ingress, and more. Each workflow is parameterised, security-reviewed, and built to the same standard: plug in your namespace and configuration, run it, get a result.
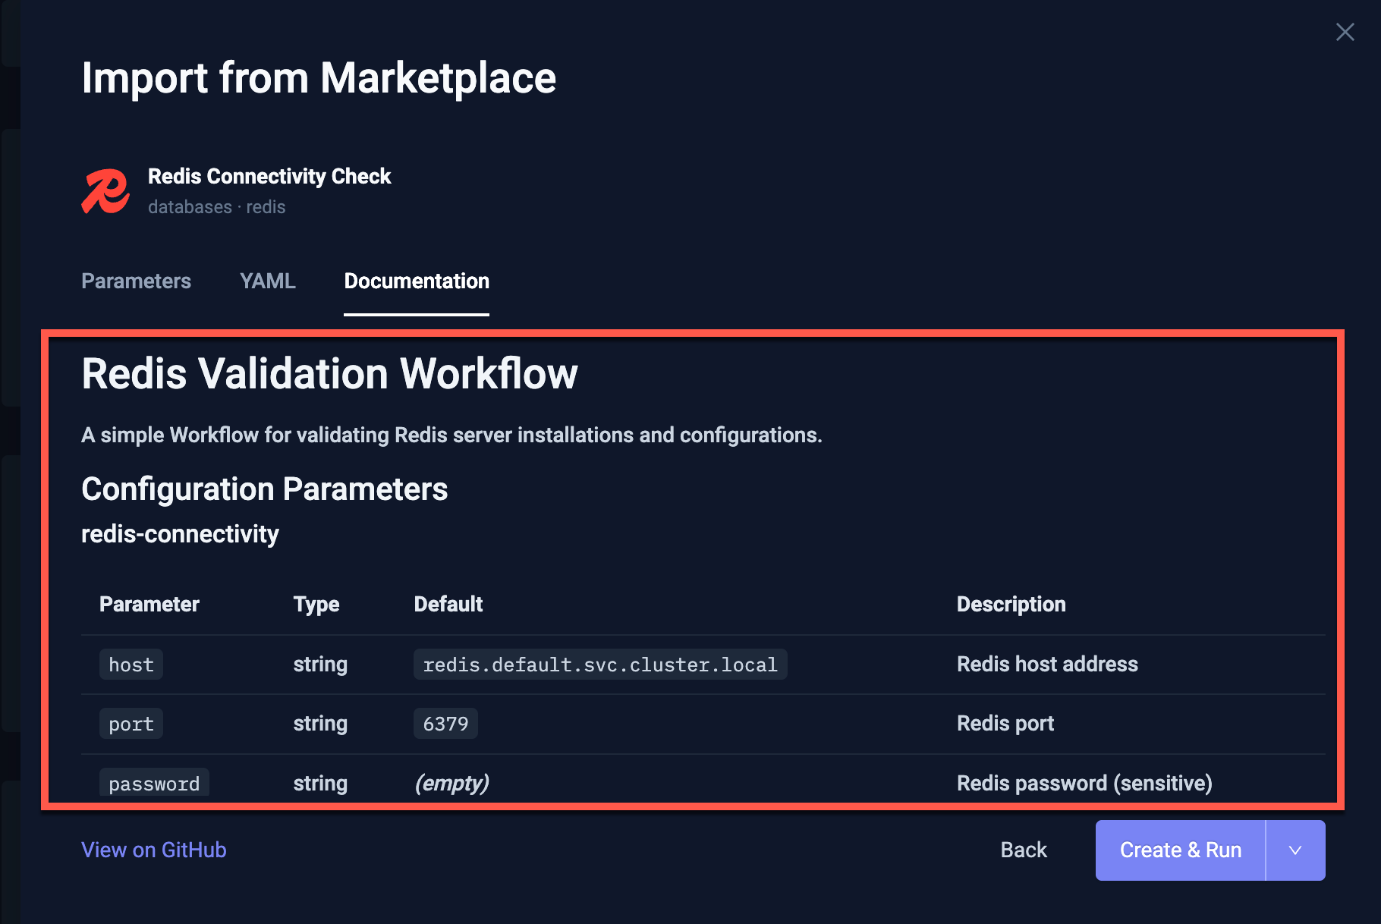
The Marketplace is actively growing. Current categories include databases, messaging, storage, networking, observability, and security. If you're running a component that isn't covered yet, the contributing guidelines are straightforward - and every workflow you add benefits every team running the same stack.
The Workflow Marketplace has a security baseline which should be met by every workflow. Images are restricted to verified registries only, all image references must be digest-pinned for immutability, and CI validations run automatically on every PR. This means that, that workflow you pull today runs the exact same image it was validated against. You can read more about the security guidelines to gain better understanding.
Conclusion
Deployment succeeded is not the same as infrastructure is healthy. By now, that distinction should feel concrete. We looked at the four specific gaps, five distinct layers, and three workflows you can apply to your cluster today.
The next step is yours. Run the pod health check against a namespace you haven't looked at in a while. Apply the PV attachment workflow after your next node replacement. Trigger the ingress check as part of your upgrade runbook. See what surfaces.
The ask is simple: pick one layer your team currently validates manually or not at all, write it as a Test Workflow, and run it on a schedule. That's the shift from assumed infrastructure health to proven infrastructure health.
Try Testkube and explore the Workflow Marketplace to see what's already available. Questions? Find us on Slack. Building something interesting on top of Testkube? Connect on LinkedIn.
About Testkube
Testkube is the open testing platform for AI-driven engineering teams. It runs tests directly in your Kubernetes clusters, works with any CI/CD system, and supports every testing tool your team uses. By removing CI/CD bottlenecks, Testkube helps teams ship faster with confidence.
Get Started with a trial to see Testkube in action.