Table of Contents
Start your free trial.

Table of Contents
Executive Summary
An AI feature ships after its promptfoo eval passes, its Ragas or DeepEval faithfulness score clears the bar, and its lm-eval benchmark looks fine. Everyone signs off. Days later, the model, or a prompt that quietly changed underneath it, regresses in production and nobody catches it, because none of those three results lived anywhere that tied back to the same model and prompt version.
Platform and DevOps engineers will recognize this failure: a regression slips through because evaluation results are scattered across tools and output files, disconnected from release decisions. Most teams already run AI evaluations with frameworks such as promptfoo, Ragas, and DeepEval, whether during development or in CI. The challenge is bringing those results together so teams can compare evaluations, track regressions, and make informed release decisions without switching between tools.
Testkube's AI metrics parser addresses this gap by converting results from AI evaluation frameworks into a common metrics format that can be visualized in Insights. In this post, we'll walk through how to connect your existing evaluation workflows to Testkube, centralize AI testing results, and track them alongside the rest of your testing data, without changing how the evaluations run.
The AI Testing Blind Spot
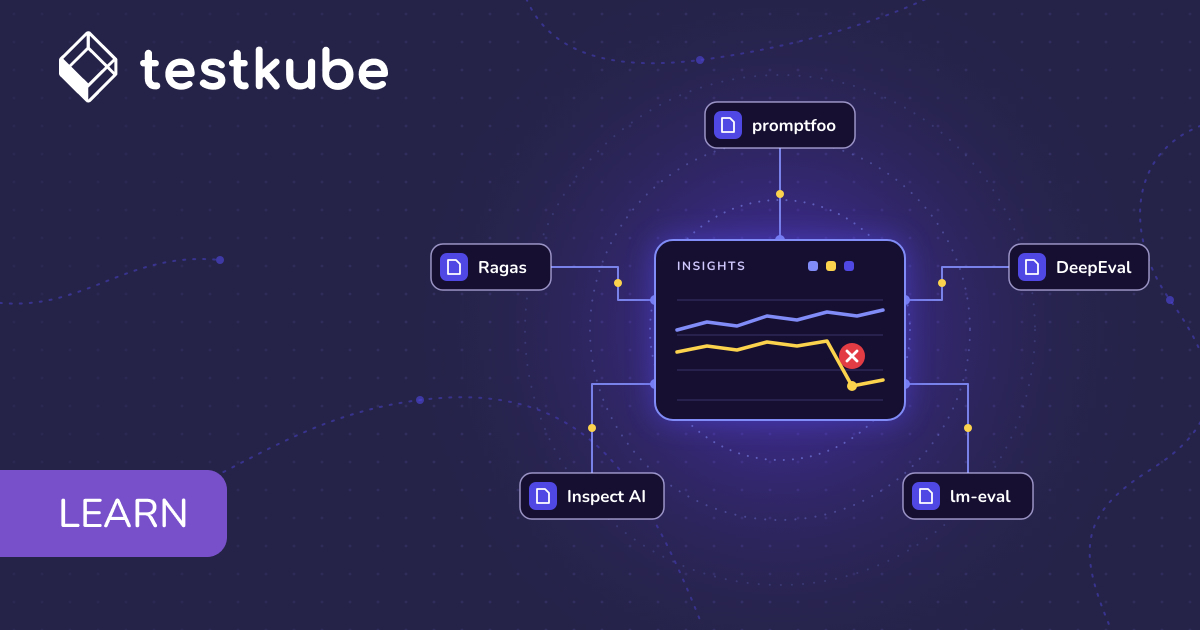
As discussed in Testing AI Systems Across Four Layers, different layers of the AI stack require different evaluation tools. Ragas, promptfoo, Inspect AI, lm-eval, and DeepEval each address distinct testing needs, but their results often remain scattered across separate reports.
Each of these tools writes its own shape of output in its own place. promptfoo produces results.json and results.html, DeepEval writes one test_run_<timestamp>.json per pytest case, and lm-eval writes one file per task or shard. None of that output sits anywhere near the Cypress, k6, or JUnit results from the same pipeline run, so a release that passes every conventional gate still has no single place to show how its AI behavior scored.
Platform teams therefore end up opening five tools, or copying numbers by hand into a spreadsheet or Slack thread, to answer “can we ship?” The answer that comes out of that process has no audit trail and cannot be repeated by the next person who is asked the same question.
The solution is to bring the output these five frameworks already produce into Testkube's shared metrics pipeline, where results from different tools can be collected, visualized, and compared in one place. Rather than introducing another evaluation framework, the goal is to make the existing ones work together through a common reporting pipeline.
Bringing AI Test Results into Insights with the AI Metrics Parser
That fix is Testkube's AI metrics parser, an open-source (MIT) component built as a small, dependency-free Go binary and published as a container image. It runs as an ordinary step in a Test Workflow and acts as a translator: it takes the results an AI testing tool already produced and rewrites them in a format Testkube already knows how to read.
That format is Influx Line Protocol. Testkube already uses it to ingest performance testing metrics from tools like k6 and Artillery. It scans workflow artifacts for line protocol files with a .lp or .influx extension and ingests their numeric fields as granular metric series that can be charted in Insights. Because Testkube reads any line protocol file, metrics from a custom framework can flow through the same path too. The AI metrics parser builds on this existing mechanism, converting evaluation results from AI testing tools into the same format so they can be ingested without any changes to Testkube itself. For platform teams, this means AI evaluation metrics can be tracked with infrastructure they already have in place.
The parser reads output from Ragas, promptfoo, Inspect AI, lm-eval, and DeepEval, five frameworks teams commonly run today. Whichever one a team runs, it works without a custom integration, and because the parser only consumes output that already exists, nothing about how the evals are written or invoked has to change. That matters because the team that owns the eval code and the team that owns the pipeline can be different, and a translator at the end of the run asks nothing of the former.
Once results are in, a team can label them by model or environment and compare them side by side in Insights, the same way it already compares performance results today. A quality score from one model version can sit next to the score from another, which turns a regression like the one in the opening scenario into a visible change on a chart. The quickest way to see all of this working is to run it, starting with a check that needs no API key.
How to Chart AI Eval Results in Testkube Insights
To demonstrate the parser, we created two demos: a simple one, in which a single eval runs end to end, and a matrix one, in which the same eval is fanned out across several models in parallel. We begin with a quick proof-of-life check, which confirms that the parser image runs in the cluster before any eval or API key is involved. Each demo adds an export step and a save step to a workflow, so the cost of adopting the parser can be judged directly from what changes in the pipeline.
Smoke Test: Verify the Parser and Insights Integration
Before connecting a real evaluation to Testkube Insights, start with a small, self-contained workflow. This smoke test uses canned Ragas results to show how the AI metrics parser converts evaluation scores into Influx Line Protocol (LP), how Testkube saves the resulting files as artifacts, and how the exported metrics become available in Insights.
The workflow follows the same export-and-save pattern used in the full evaluation demos. It creates a sample ragas_results.json file with three question-and-score records, passes that file to the parser, and saves both the original JSON and the generated .lp file as artifacts. This keeps the focus on the integration between the parser, artifacts, and Insights without requiring an API key or a live evaluation.
To run the smoke test:
- Save the workflow below as
ragas-smoke-test.yaml. - Create it in Testkube, for example with
kubectl testkube create testworkflow -f ragas-smoke-test.yaml. - Run it, for example with
kubectl testkube run testworkflow ragas-smoke-test -f. - Open the execution's Artifacts tab and confirm
ragas_results.lpis listed besideragas_results.json. - Open the Insights tab, create an analysis with the measure set to Custom Report Metrics, and pick a Ragas series.
The execution shows each workflow step completing in order:
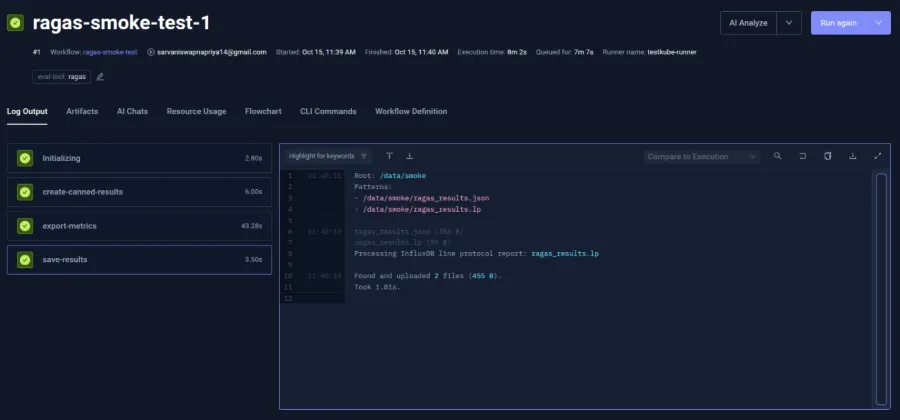
In Insights, the Ragas scores appear as their own custom report metric series:
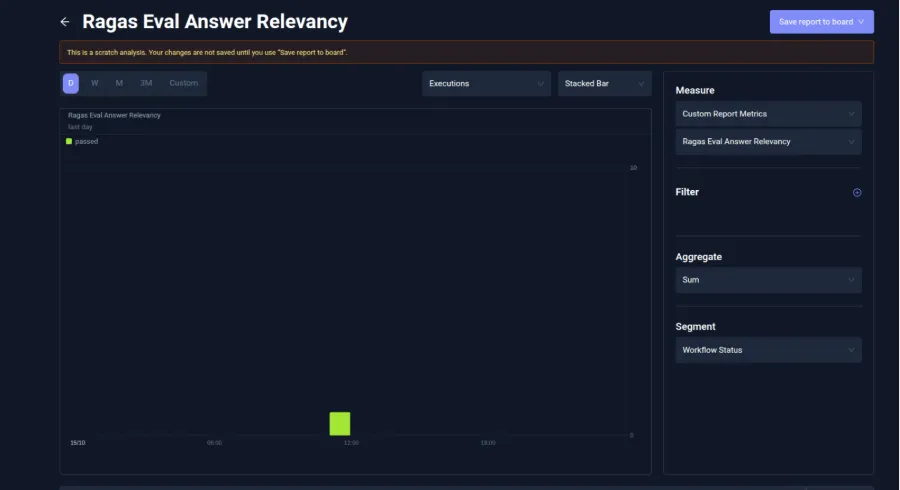
Here is the workflow we used:
apiVersion: testworkflows.testkube.io/v1
kind: TestWorkflow
metadata:
  name: ragas-smoke-test
  namespace: testkube
spec:
  container:
    workingDir: /data/smoke
  execution:
    tags:
      eval-tool: ragas
  steps:
  - name: create-canned-results
    container:
      image: docker.io/kubeshop/testkube-ai-metrics-parser:latest
      imagePullPolicy: Always
    shell: |
      mkdir -p /data/smoke
      cat > ragas_results.json <<'EOF'
      [
        {"question": "What is Testkube?", "faithfulness": 0.91, "answer_relevancy": 0.87, "context_precision": 0.82},
        {"question": "How do I run a workflow?", "faithfulness": 0.88, "answer_relevancy": 0.90, "context_precision": 0.79},
        {"question": "Where are artifacts stored?", "faithfulness": 0.95, "answer_relevancy": 0.84, "context_precision": 0.86}
      ]
      EOF
  - name: export-metrics
    condition: always
    container:
      image: docker.io/kubeshop/testkube-ai-metrics-parser:latest
      imagePullPolicy: Always
    shell: |
      testkube-ai-metrics-parser ragas \
        -i ragas_results.json \
        -o ragas_results.lp \
        --tag suite=smoke-test \
        --stdout
  - name: save-results
    condition: always
    artifacts:
      paths:
      - ragas_results.json
      - ragas_results.lp
Here's what each part of the workflow does:
- workingDir: /data/smoke gives every step the same working directory, which is shared between steps, so the export step can read the file that the first step wrote.
- create-canned-results writes
ragas_results.jsonwith three question-and-score records. It runs on the parser image, so the smoke test needs no separate eval image and no API key. - export-metrics runs
testkube-ai-metrics-parser ragason that file and writesragas_results.lp. The--tag suite=smoke-testoption labels the metric itself, and--stdoutalso echoes the line protocol into the execution log. - save-results uploads both files as artifacts, which is the point at which Testkube picks up the
.lpfile for ingestion. Both this step and the export step usecondition: always, so they run even when an earlier step fails. - execution.tags labels each run of the workflow with
eval-tool: ragas. This is separate from the parser's--tag: the first labels the execution, and the second labels the metric.
The resulting .lp file holds a single line of Influx Line Protocol, with each score averaged across the three records:
ragas_eval,suite=smoke-test answer_relevancy=0.87,context_precision=0.823333,faithfulness=0.913333Demo 1: Exporting promptfoo Results to Insights
For the first demo, the eval is promptfoo's own getting-started example, an unmodified public project in which two OpenAI models translate two short English inputs into French and Spanish, producing four test cases. Using it keeps the demo reproducible, since anyone can pull the same content source.
- Pull promptfoo's getting-started example from its public repo as the workflow's content source.
- Run the eval as the first step:
npx promptfoo@latest eval -o results.json -o results.html. - Add an export-metrics step on the parser's image, reading
results.jsonand writingresults.lp. - Add a save-results step whose
artifacts.pathspicks upresults.json,results.html, andresults.lp. - Set
condition: alwayson both new steps so metrics land even when the eval step fails. - Run the workflow and open the execution's Artifacts tab to confirm
results.lpis there.
The run-eval step's log shows the four test cases:
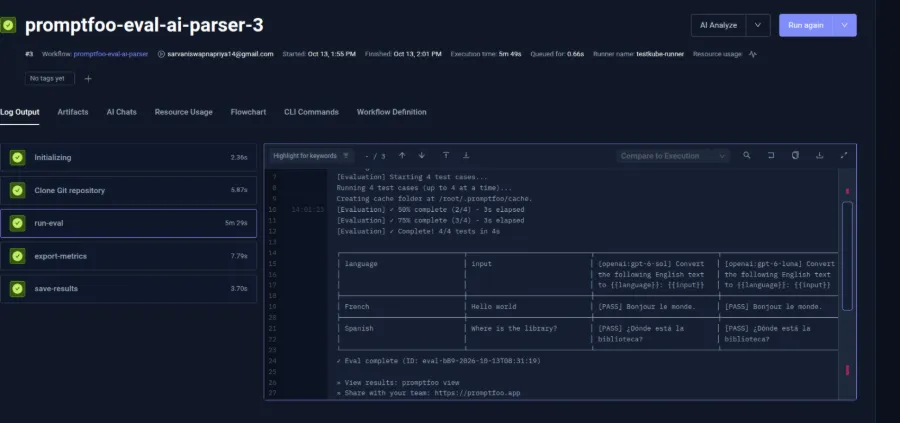
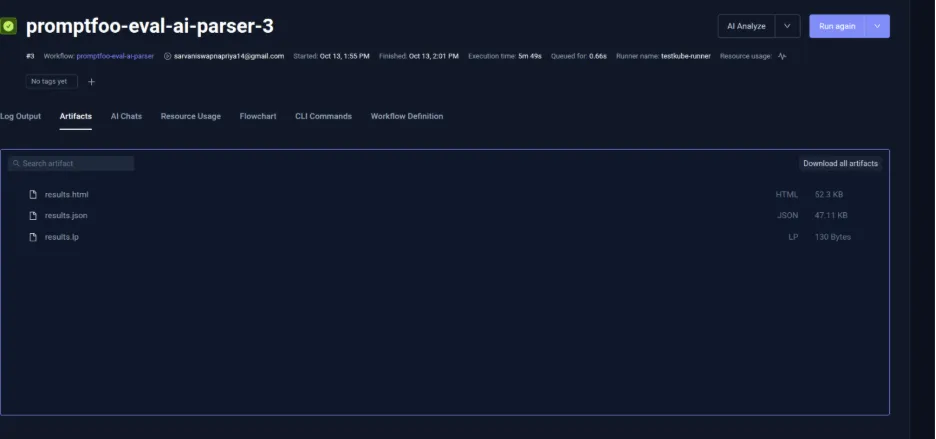
The Artifacts tab then lists three files: results.html, results.json, and results.lp.
From the Insights tab, create an analysis using Custom Report Metrics and select the promptfoo series. The two charts provide complementary views of evaluation results:
- Eval Successes shows the total number of successful evaluations. This helps you understand how many evaluations passed and whether the volume of successful tests changes between runs.
- Eval Pass Rate shows the proportion of evaluations that passed. Since this is a ratio, Maximum is used as the aggregation method to display its value of 1 when the pass rate is 100%. Tracking this metric across runs helps identify regressions and determine whether a new model or prompt performs consistently against the evaluation criteria.
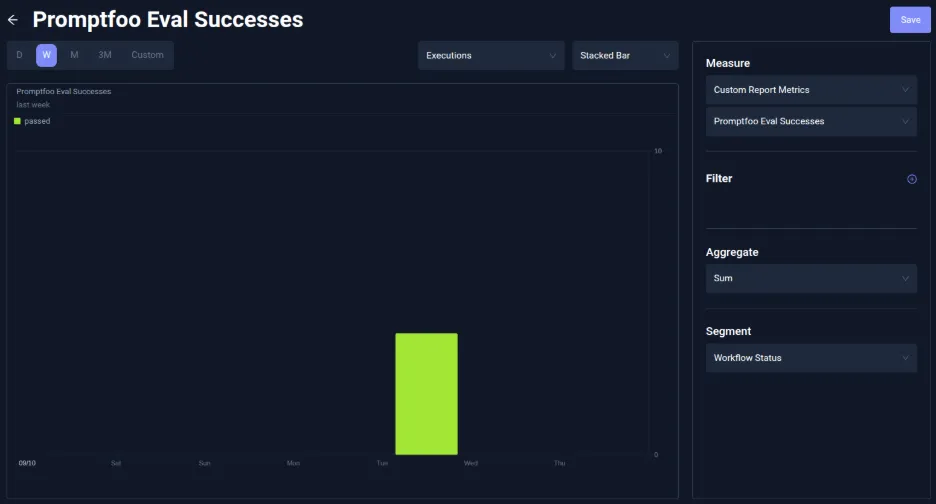
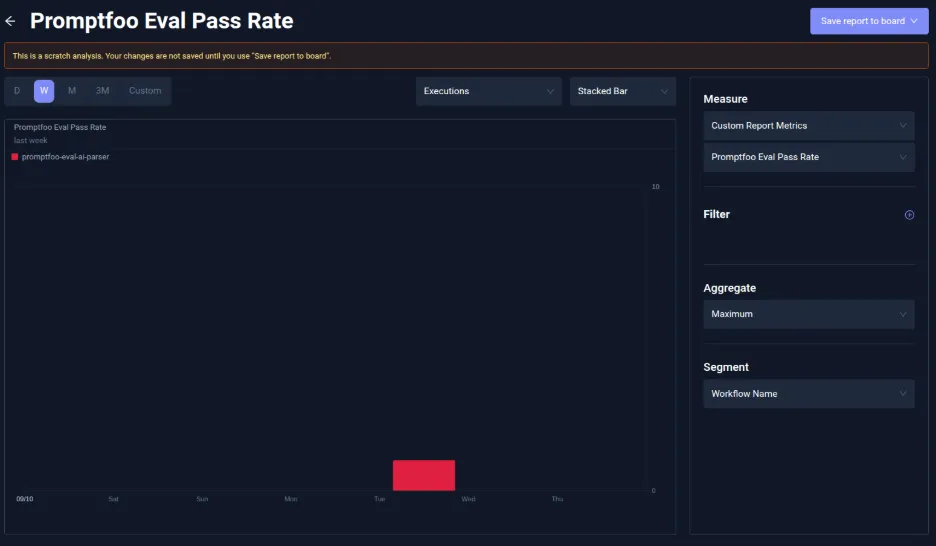
Together, these metrics help teams distinguish between the number of successful evaluations and the overall pass rate, making it easier to spot regressions and assess readiness for release. For background on what evaluation metrics such as faithfulness and answer relevancy measure, see Testing AI Systems Across All Four Layers, which covers Ragas, DeepEval, and promptfoo layer by layer. For how those scores become pass or fail thresholds that gate a release, see How to Integrate AI Testing in Delivery Pipelines.
The complete workflow looks like this. The export step also attaches a suite tag, which becomes an identity field that Insights can segment and filter by.
kind: TestWorkflow
apiVersion: testworkflows.testkube.io/v1
metadata:
  name: promptfoo-eval-ai-parser
  namespace: testkube
spec:
  content:
    git:
      uri: https://github.com/promptfoo/promptfoo
      revision: main
      paths:
      - examples/getting-started
  container:
    workingDir: /data/repo/examples/getting-started
    env:
    - name: OPENAI_API_KEY
      valueFrom:
        secretKeyRef:
          name: openai-secrets
          key: api-key
    - name: PROMPTFOO_DISABLE_TELEMETRY
      value: "1"
  steps:
  - name: run-eval
    container:
      image: node:22-bookworm
    shell: |-
      set -euxo pipefail
      npx promptfoo@latest eval -o results.json -o results.html
  - name: export-metrics
    condition: always
    container:
      image: docker.io/kubeshop/testkube-ai-metrics-parser:latest
      imagePullPolicy: Always
    shell: |
      testkube-ai-metrics-parser promptfoo \
        -i results.json \
        -o results.lp \
        --tag suite=promptfoo-getting-started \
        --stdout
  - name: save-results
    condition: always
    artifacts:
      paths:
      - results.json
      - results.html
      - results.lp
Demo 2: Comparing promptfoo Results Across Models
The second demo keeps the pipeline from the first and runs it across several models in parallel, so results from every model land in the same run and can be compared side by side. In a matrix Test Workflow, each parallel worker handles one model, and the export step sits inside the parallel block, tagged --tag model={{matrix.model}}. It belongs there because each worker has its own filesystem, so only an export inside the block can see that worker's results.
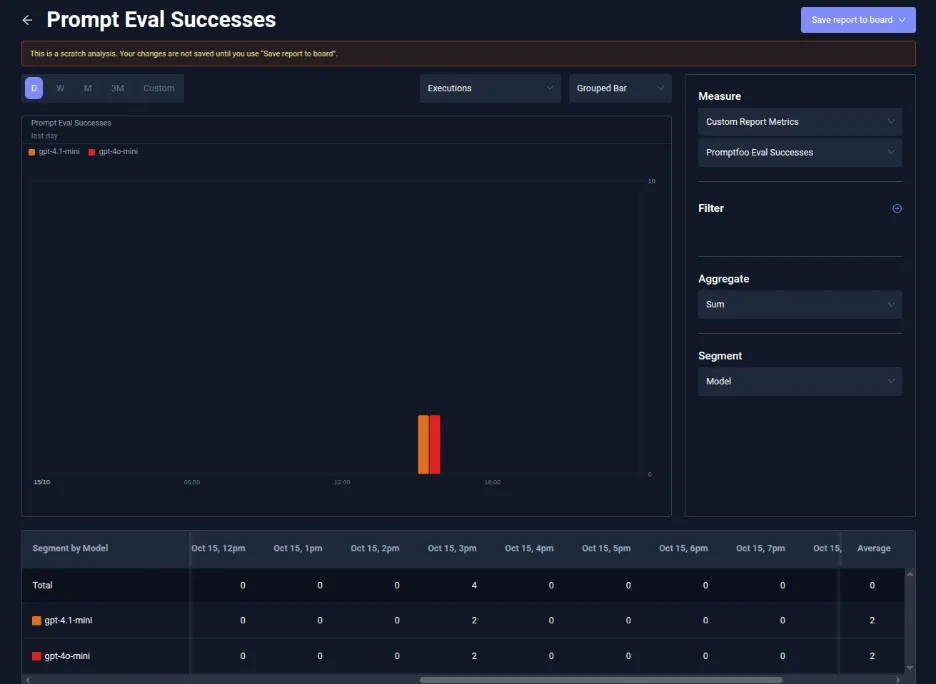
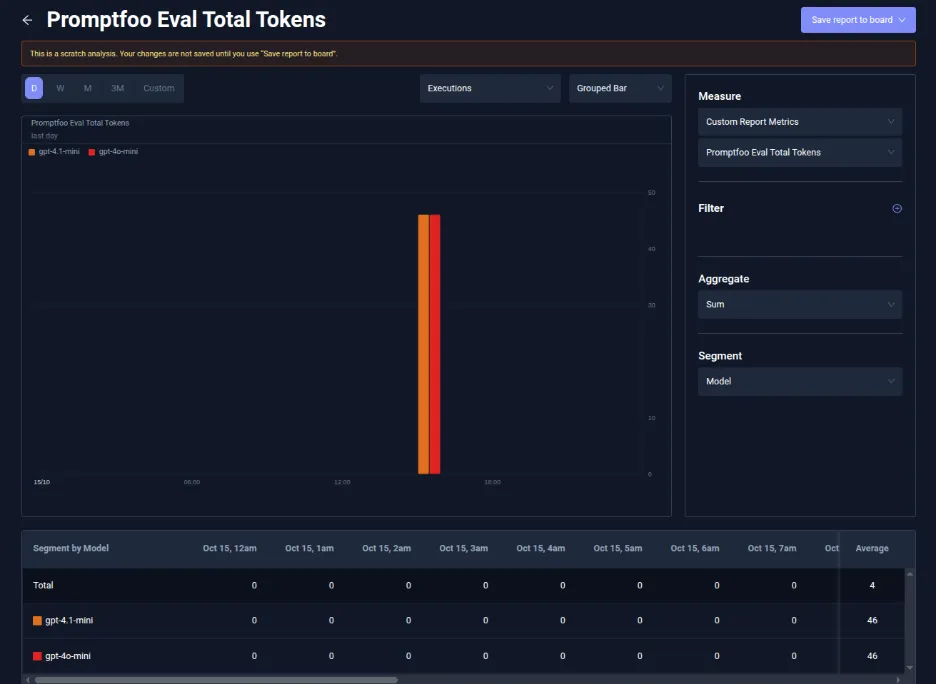
- Define a matrix over the model, with one parallel worker per model. This run used gpt-4o-mini and gpt-4.1-mini, and
parallelism: 2runs both workers at the same time. - Run the eval inside each worker for its own model.
- Place the export step inside the parallel block so it sees that worker's results.
- Tag the export with
--tag model={{matrix.model}}. - Set
condition: alwayson the export step and the save step. - Add a step that saves the raw results and the .lp file as artifacts, then run the workflow.
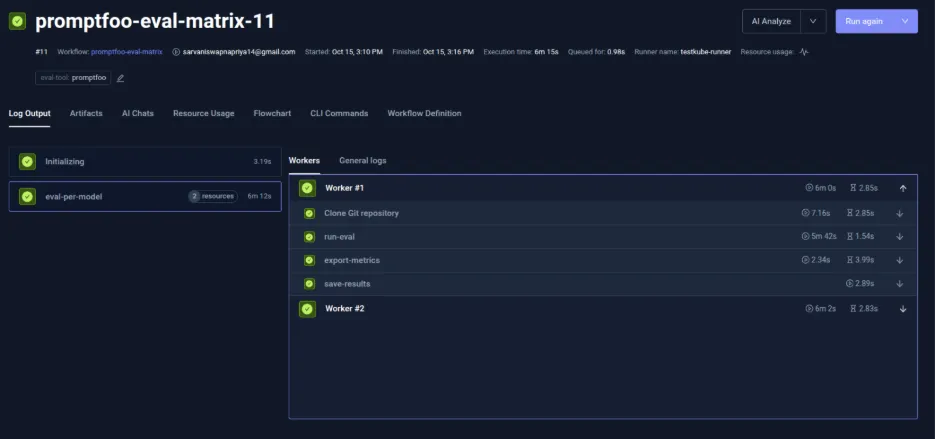
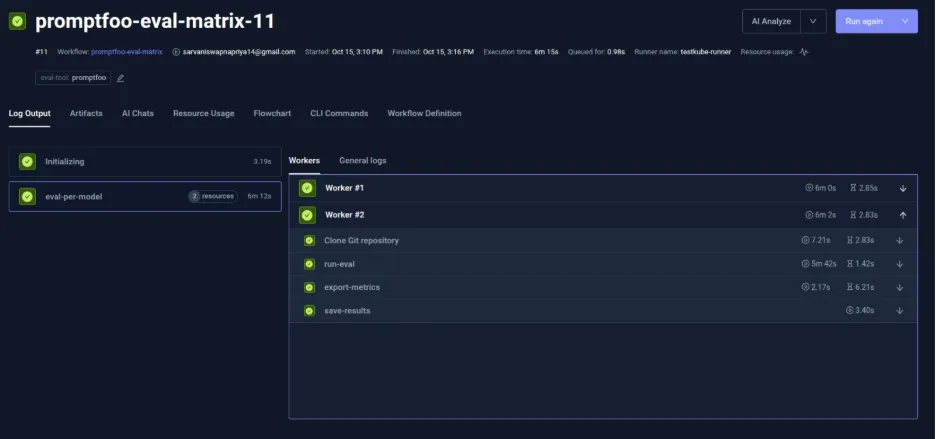
Each worker runs the same four steps in order: Clone Git repository, run-eval, export-metrics, and save-results. The export and save steps add only a few seconds to a worker that spends nearly all its time on the eval. Both workers took about 6 minutes, and because they ran side by side, the whole execution finished in 6m 15s.
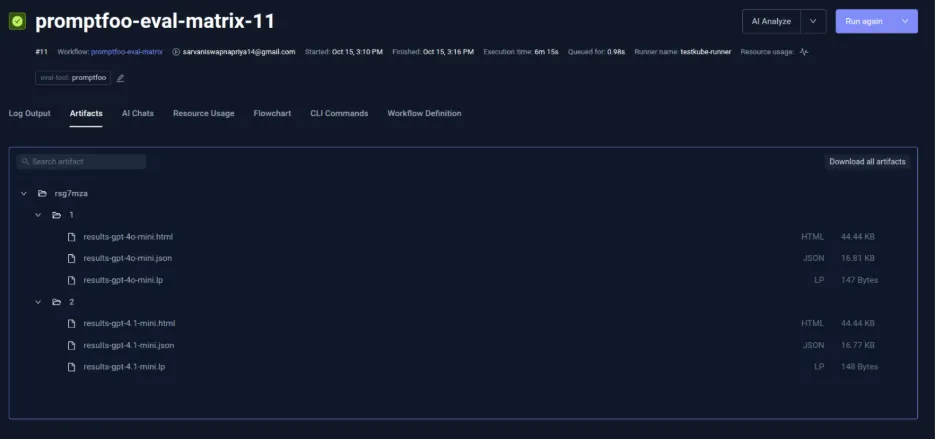
In the execution's Artifacts tab, each worker saves its own folder with an HTML report, the raw JSON, and a small .lp file, one for gpt-4o-mini and one for gpt-4.1-mini.
To visualize the results as a whole, open the Insights tab, choose a metric under Custom Report Metrics (for example, Promptfoo Eval Successes or Promptfoo Eval Total Tokens), set Segment to Model, and compare the models side by side. The charts below show both metrics segmented by model.
Here is the workflow used for this demo:
kind: TestWorkflow
apiVersion: testworkflows.testkube.io/v1
metadata:
  name: promptfoo-eval-matrix
  namespace: testkube
spec:
  execution:
    tags:
      eval-tool: promptfoo
  steps:
  - name: eval-per-model
    parallel:
      parallelism: 2
      matrix:
        model:
        - gpt-4o-mini
        - gpt-4.1-mini
      content:
        git:
          uri: https://github.com/promptfoo/promptfoo
          revision: main
          paths:
          - examples/getting-started
      container:
        workingDir: /data/repo/examples/getting-started
        env:
        - name: OPENAI_API_KEY
          valueFrom:
            secretKeyRef:
              name: openai-secrets
              key: api-key
        - name: PROMPTFOO_DISABLE_TELEMETRY
          value: "1"
      steps:
      - name: run-eval
        container:
          image: node:22-bookworm
        shell: |-
          set -euxo pipefail
          npx promptfoo@0.124.1 eval \
            -r openai:{{matrix.model}} \
            -o results-{{matrix.model}}.json \
            -o results-{{matrix.model}}.html
      - name: export-metrics
        condition: always
        container:
          image: docker.io/kubeshop/testkube-ai-metrics-parser:latest
          imagePullPolicy: Always
        shell: |
          testkube-ai-metrics-parser promptfoo \
            -i results-{{matrix.model}}.json \
            -o results-{{matrix.model}}.lp \
            --tag suite=promptfoo-getting-started \
            --tag model={{matrix.model}} \
            --stdout
      - name: save-results
        condition: always
        artifacts:
          paths:
          - results-*.json
          - results-*.html
          - results-*.lp
Both demos show how existing AI evaluation results can be brought into Testkube Insights with minimal changes to the pipeline. Whether you're running a single evaluation or testing multiple models in parallel, the same export step makes the results available for visualization and comparison. The evaluation tools, test files, and commands remain unchanged; you only add the export and save steps. This lets teams build on their existing AI testing workflows while making evaluation trends, regressions, and model performance easier to track as runs accumulate.
Best Practices for AI Evaluation Data in Testkube
The demos add two steps beyond the eval: an export step and a save step. The practices below cover how to configure them in Testkube and the data they produce. The underlying principles apply to any eval pipeline: tag consistently, fail on empty results, capture results even when the eval fails, and keep the raw output. The flags and settings named here are specific to Testkube.
- Settle tags before the first real run. Use a small, consistent set such as model, environment, and suite. The parser adds no tags on its own, so each one has to be passed explicitly with
--tagat export time. A run's tags are fixed once it is recorded, so they cannot be added retroactively, and any run recorded without them stays out of the comparisons that depend on them. - Enable
--fail-on-empty. It makes the export step exit non-zero when it finds no metrics. Without it, a run whose glob matched nothing, or whose files held no usable results, prints a warning and exits cleanly, so it can blend in with a run that actually passed. The parser already fails on its own when every matched file is unreadable, so the flag covers these quieter cases. - Put both the export and save steps on
condition: always. Metrics matter most when an eval fails, since that is the data worth debugging, so neither step should depend on the eval step succeeding. - Keep the raw output and the parsed .lp file as artifacts. The raw output is the JSON or HTML report, and keeping it preserves the detail that aggregation removes. Insights shows the aggregated numbers, while the original file remains in the Artifacts tab for anyone who needs to examine individual test cases. Because artifacts are scoped to the execution that produced them, they also supply the audit trail that the “can we ship?” question lacked in the first place.
Applied together, these four habits keep AI results as comparable and traceable as the rest of the pipeline's test data.
Conclusion
AI-powered features need the same evaluation discipline as any other part of your application. But evaluation results are most useful when they live alongside the rest of your testing data, where teams can compare results, track regressions, and make release decisions.
The AI metrics parser bridges this gap by converting evaluation outputs from five frameworks (Ragas, Inspect AI, promptfoo, lm-eval, and DeepEval) into Influx Line Protocol that Testkube can ingest. Once ingested, AI evaluation metrics appear in Testkube Insights under Custom Report Metrics, alongside the granular metrics teams already collect from tools like k6 and Artillery. Teams can filter and chart these results to track model behavior, identify regressions, and make more informed release-readiness decisions.
The parser repository includes five example Test Workflows that you can adapt to your own evaluation pipelines. Try the smoke test, which requires no API key, or open an issue to request support for another framework.
Frequently Asked Questions
{{banner-get-started}}
About Testkube
Testkube is the testing platform for the agentic SDLC. It runs tests directly in your Kubernetes clusters, works with any CI/CD system, and supports every testing tool your team uses. By removing CI/CD bottlenecks, Testkube helps teams ship faster with confidence.
Get Started with a trial to see Testkube in action.