Table of Contents
Start your free trial.
Start your free trial.

Start your free trial.



Table of Contents
Executive Summary
Our previous post discussed how it's easier for teams to test the scaffolding around AI systems but not the AI itself. You load test your infrastructure, red team the application. But what about the model's actual reasoning and the agent's decision making? That's mostly untouched. And you realize these issues when your agents start 'misbehaving'.
In this post, we take the AI stack discussed in the previous post and look at what testing all four layers could look like - with a walkthrough of what it does look like, tool by tool, with the outputs each one produces along the way.
By the end of this post, you'll walk away with a working pattern and understand which tool to use for which layer, why that layer breaks in a way others don't, where all four sets of results need to land so someone can actually look at them together and how Testkube helps you achieve all of this.
Testkube: the orchestration layer across the stack
Testkube in itself isn't a testing tool for AI systems. It doesn't evaluate a model's reasoning and it doesn't red-team your prompts. What it does do is run and aggregate whatever testing tool applies at each layer, so infrastructure checks, model evals, agent tests, and red-team results all execute the same way and report to the same place.
Each layer of the AI stack needs a different kind of testing tool. And the biggest problem is that none of them talk to each other by default. NVIDIA's tooling checks GPU health. lm-eval and ragas evaluate model output. DeepEval checks agent and RAG behavior. Promptfoo red-teams the deployed application. Four tools, four output formats, four places those results live in.
This is exactly where Testkube's role kicks in: it sits underneath all of them as the layer that makes their results usable together.
- Testkube turns any of these tools, whatever script or CLI it ships with, into a standardized, executable Test Workflow, the same CRD-based building block whether it's running a GPU health check or a DeepEval suite. One catalog, one way to define, label, and version every test across all four layers, instead of four bespoke setups nobody maintains consistently.
- All of these tools execute inside Testkube's infrastructure. They run as workflows inside your own Kubernetes clusters, triggered by CI/CD, a schedule, an API call, or a Kubernetes event, with Testkube handling the setup and teardown for each one.
- Every workflow's log, artifacts, and results land in the same place, regardless of which of the four tools produced them. You get full lifecycle visibility per run, plus an analytics view tracking pass rates and trends across every layer at once, instead of four dashboards you have to cross-reference by hand.
- Because everything reports through the same execution history, Testkube's AI agents can correlate a failure at one layer against signals from another, without someone stitching four tools' output together manually.
That's the same tool-sprawl problem we discussed in the previous post. Without a platform pulling these results into one place, you can run every one of these tests perfectly and still have no answer to "is this AI system actually trustworthy," because that answer only exists when you can see all four signals side by side.
Let us now look at the various layers, testing tools at each layer and how Testkube integrates with them.
Testing your AI stack
Let us now understand the various ways and tools that we can use for each layer of the AI stack to test and validate.

Layer 1: Infrastructure
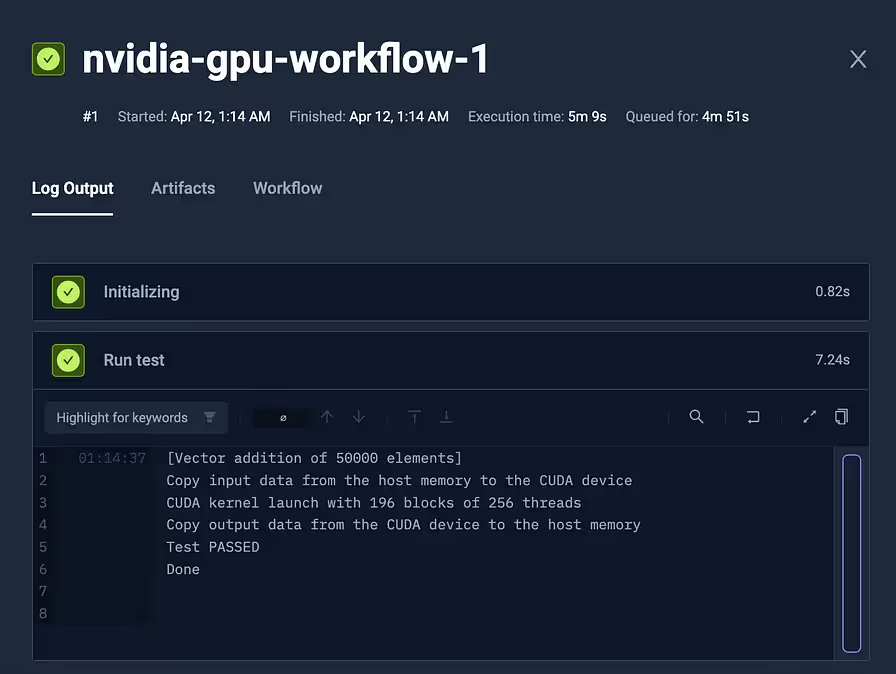
Start at the bottom. This is where the system is going to have the compute, storage, networking and more importantly GPUs. This is a standard requirement for any hardware-dependent workload - could be AI or non-AI. In case of AI workloads, what changes is the signal you're actually watching. It's not "did the process start." It's "did the model finish loading, and is the GPU actually holding the memory it claims to."
We've written about testing GPU resources in Kubernetes with Testkube before, and the pattern from that post still holds here, just pointed at an AI-specific workload instead of a generic CUDA matrix calculation.
The short version: Kubernetes exposes hardware through the Device Plugins framework, the NVIDIA Device Plugin advertises GPUs to the scheduler, and a TestWorkflow requests that GPU the same way any Pod would.
apiVersion: testworkflows.testkube.io/v1
kind: TestWorkflow
metadata:
  name: model-serving-gpu-check
  namespace: testkube
spec:
  container:
    resources:
      limits:
        nvidia.com/gpu: 1
        memory: 200Mi
        cpu: 100m
      requests:
        nvidia.com/gpu: 1
        memory: 200Mi
        cpu: 100m
  pod:
    nodeSelector:
      cloud.google.com/gke-accelerator: nvidia-tesla-t4
  steps:
    - name: Check GPU allocation and model load state
      run:
        image: your-model-serving-check-image
In the original hardware testing post, the workload was a CUDA sample proving the GPU was schedulable at all - a fine proof point for "does this cluster have a working GPU node," but not an AI-specific signal on its own.
For an actual model-serving check, you swap that step for something that queries the serving process directly: is the model loaded, how much GPU memory is it actually holding, is inference latency inside bounds. Same TestWorkflow shape, same GKE Autopilot setup from that earlier post provisioning the node on demand, different question being asked of it.

This is the layer that resembles familiar chaos and load testing the most closely. The only real shift is which counters you're reading off the node.
Layer 2: Model
One layer up, you're not testing whether the model is running - you're testing whether what it's saying is any good. This is where non-determinism stops being theoretical. Run the same prompt twice and you can get two different answers, both individually defensible. Pass/fail as a binary doesn't survive contact with that.
For RAG systems specifically, RAGAS measures two things that matter:
- Faithfulness - does the answer stay grounded in what was actually retrieved, or did the model hallucinate.
- Answer Relevancy - does it actually address the question. Rather than expecting a fixed output, you score against a maintained set of test cases and watch whether those scores hold steady across runs.
The evaluation flow is simple:
- Testkube starts a workflow that runs RAGAS across all 20 test cases.
- Each case is evaluated against two metrics: faithfulness and answer relevancy.
- Results are exported in InfluxDB line protocol format so they can be tracked consistently over time.
- If either metric falls below the configured threshold - 0.80 for faithfulness or 0.80 for answer relevancy - the test fails.
- The developer gets immediate feedback in the logs, including the specific test cases that failed.
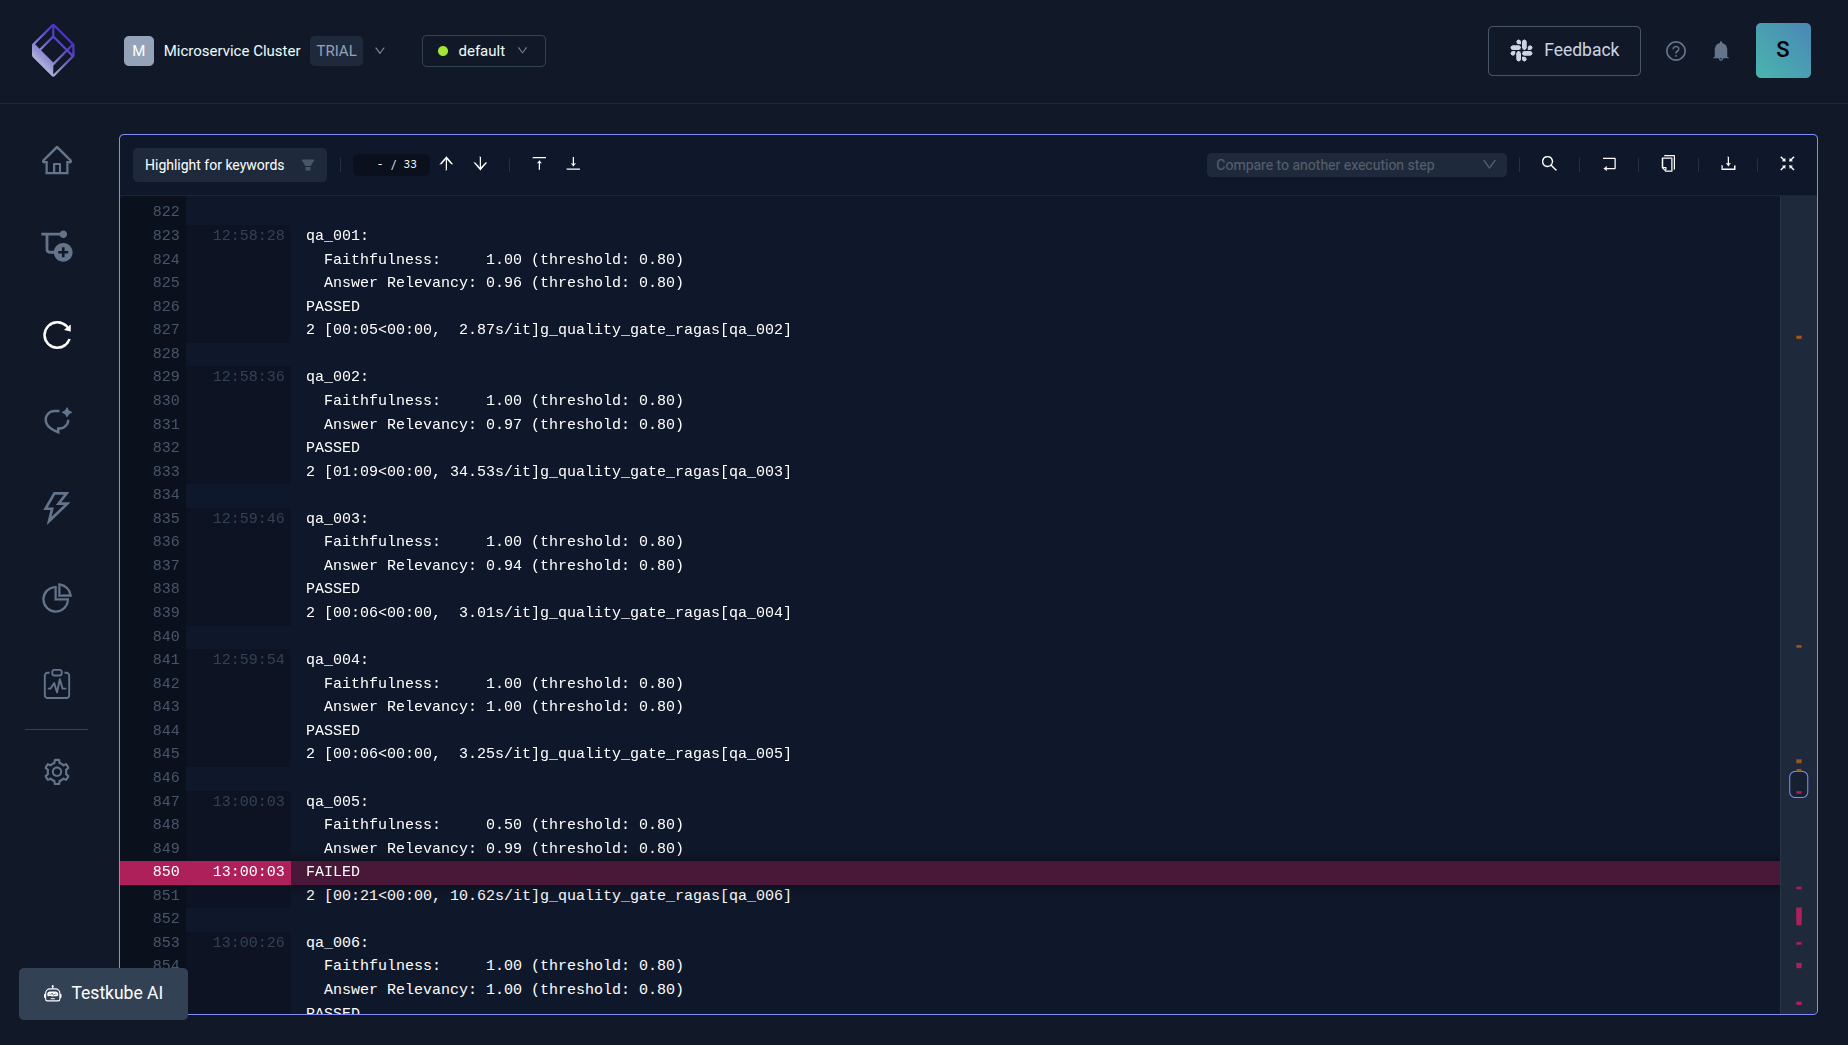
You can find the full test implementation, metric calculations, and Testkube integration in the Testkube Ragas Github repository. The output is a metrics report - mean/min/max scores per metric, per category, and per test case - that tracks quality degradation the moment it happens, not weeks later when users complain.
Layer 3: Orchestration/Agent
Move up the AI stack and you're no longer asking "is the model's raw output good" but "did the whole chain of steps hold together." This is the layer Part 1 flagged as the one where small errors compound silently - a mistake three steps into a multi-step chain doesn't surface immediately, it surfaces later as a symptom that looks nothing like its actual cause.
The demo here comes from a RAG quality gate built with Testkube and DeepEval, gating a RAG pipeline as it moves through CI. The flow is straightforward:
git push (RAG code change)
↓
GitHub Action triggered
↓
Testkube runs a TestWorkflow with 20 automated test cases
↓
DeepEval scores: Faithfulness, Contextual Recall, Answer Relevancy
↓
Pass or fail - a quality drop blocks the merge
The TestWorkflow lives in the repo, triggered by a GitHub Action on every push, and runs as a Kubernetes pod that clones the repo, installs dependencies, and runs the DeepEval test suite against a set of fixed Q&A test cases:
metrics = [
    FaithfulnessMetric(threshold=0.80),
    ContextualRecallMetric(threshold=0.75),
    AnswerRelevancyMetric(threshold=0.80),
]
Each metric is checking something specific: faithfulness asks whether the answer hallucinated anything not present in the retrieved context, contextual recall asks whether the retriever actually found the relevant documents in the first place, and answer relevancy asks whether the response is actually addressing the question. If any one of those three drops below threshold, the test fails and the merge gets blocked - the same gate you'd expect from any CI quality check, just scoring an LLM's output instead of a unit test's assertion.
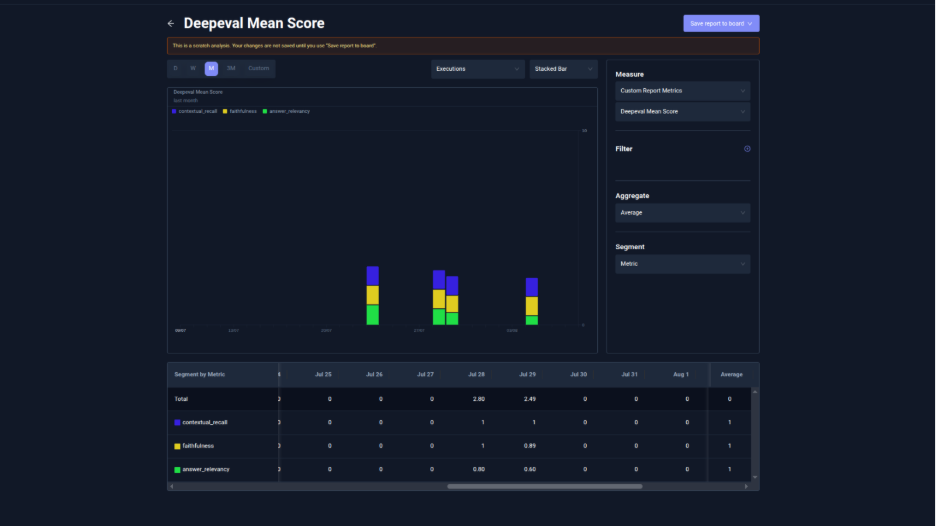
What comes out the other end is a results JSON with a score per metric, per test case - 20 cases run, 20 sets of three scores, an aggregate pass or fail.
Below is the InfluxDB format ingested by Testkube for custom metrics. In this scenario, the data is generated by the Testkube ai-metrics-parser from the DeepEval result files.
deepeval,metric=answer_relevancy,suite=rag-quality-gate cost=0.000315,errors=0i,failed=0i,mean_score=0.8,passed=1i,tests=1i

deepeval,metric=contextual_recall,suite=rag-quality-gate cost=0.000183,errors=0i,failed=0i,mean_score=1,passed=1i,tests=1i

deepeval,metric=faithfulness,suite=rag-quality-gate cost=0.000378,errors=0i,failed=0i,mean_score=1,passed=1i,tests=1i

deepeval,suite=rag-quality-gate errors=0i,failed=0i,passed=3i
That's the kind of output that's easy to check in isolation and easy to lose track of if it's sitting in its own GitHub Actions log while your infrastructure and application results live somewhere else entirely.
Layer 4: Application
At the top of the stack is the deployed application: the actual prompts a user hits, the guardrails wrapped around them, and whether either one holds up against someone actively trying to break it. This is the layer closest to security testing you already know how to run, with jailbreaks, prompt injection, and policy violations standing in for the usual OWASP-style attack list.
Promptfoo is the tool that fits here, running in red-team mode against your deployed prompts and testing against the OWASP LLM Top 10 - prompt injection attempting to override system instructions, jailbreak attempts, PII leakage, and more. Worth noting as of this writing: Promptfoo was acquired by OpenAI in March 2026, which is a fact worth flagging for anyone deciding how to weigh a red-teaming dependency going forward, not a reason on its own to avoid it.
The reason this layer needs its own kind of test, separate from Layer 2's model eval, is scope. You're not testing whether the model can be tricked in the abstract - you're testing whether your specific application, with your specific system prompt and guardrails, holds up. A model can pass every general safety benchmark and still have an application built on top of it that leaks its system prompt to the first person who asks the right way.
A Promptfoo red-team config runs as YAML, easy to version and run the same way through a TestWorkflow as any other test in this stack, and the output is a report of attack attempts against pass/fail per vulnerability category - which jailbreak variants got through, which injection attempts the guardrails caught, where the attack surface is actually thin.
In the example shown below, we created a Finbuddy chat application that helps people learn finance terms. However, without any proper guardrails or system prompts, anyone can bypass and trick it to share sensitive information. We ran the Promptfoo test with the default configuration and we could see the vulnerabilities in our prompt.

The report.json file that contains the output tells exactly how our prompts were and the vulnerabilities it discovered. You can look at the Testkube Promptfoo GitHub repo to try and see the code.
Because instructions and data share the same channel in these systems, this isn't a category of test you run once and check off. It runs continuously, the same way you'd never consider a security scan "done" after a single pass.
What's next
Look at what just happened across those four layers: four different tools, four different output formats, and left to themselves, four different places those results would live. An infrastructure check in one dashboard. A model eval script's console output. A GitHub Actions log for the RAG gate. A red-team report sitting in whatever directory Promptfoo wrote it to. Nobody's looking at all four of those in the same sitting, because nothing's forcing them into the same place.
That's exactly the gap Testkube closes. It doesn't care which tool produced a result - NVIDIA's health check, DeepEval's metrics, Promptfoo's red-team report, whatever Layer 2 ends up using - it gives all of them one place to execute from and one place to be reviewed, so infrastructure, model, agent, and application results sit next to each other instead of scattered across four tools nobody cross-references.
That centralization is also what makes the next step possible. Testkube's AI agents already do a version of root cause correlation at the infrastructure layer - correlating a k6 test failure with cluster signals and filing a Jira ticket automatically, without someone manually cross-referencing logs. That pattern isn't proven yet across all four AI-system layers. But it's the natural next step once every layer's results report to the same place, not a claim that it's already happening across the model, agent, and application layers today.
You can't point an AI agent at signals it can't see. Centralized visibility across all four layers is the precondition, not an afterthought - which is exactly why the orchestration layer has to come before the triage layer, not the other way around.
Conclusion
Four layers, four tools: NVIDIA-based checks for infrastructure, lm-eval and ragas for the model, DeepEval for the RAG pipeline and agent layer, Promptfoo for the deployed application's guardrails. Each one testing something the others structurally can't, run through Testkube so the results actually end up somewhere you can compare them.
Part 1 argued that the model and orchestration layers are the two your team is probably skipping. This is what closing that gap actually looks like in practice, not just as an argument.
Want to see what testing all four layers together looks like for your own AI system? Talk to the Testkube team.
{{banner-get-started}}
About Testkube
Testkube is the open testing platform for AI-driven engineering teams. It runs tests directly in your Kubernetes clusters, works with any CI/CD system, and supports every testing tool your team uses. By removing CI/CD bottlenecks, Testkube helps teams ship faster with confidence.
Get Started with a trial to see Testkube in action.