.png)
Table of Contents
Start your free trial.
Start your free trial.
Start your free trial.

Table of Contents
Executive Summary
Load tests are great at finding problems in a system. They push services to their limits and reveal failures long before users ever see them. But while tests are very good at saying something broke, they are much less helpful at explaining why. The real work usually begins after the failure. Engineers open logs, scan Kubernetes events, check resource metrics, and try to connect the dots across multiple services. The data exists, but piecing it together can still take time. What if the investigation could start automatically the moment a test fails?
In this post, we explore how Testkube AI Agents can automate root cause analysis. Using MCP servers to access Kubernetes and Jira, the agent can gather system signals, analyze failures, and generate a structured RCA report directly from a testing workflow.
Introduction: when testing ends, investigation begins
Modern testing pipelines have become highly sophisticated. Teams can simulate production scale traffic, run complex workflows, and collect detailed telemetry during every test execution. When a test fails in a cloud native system, engineers need to understand what actually happened inside the environment. This usually involves manually investigating multiple signals such as pod logs, Kubernetes events, resource utilization metrics, and application traces.
In microservices architectures, failure investigation is slow and error-prone and even experienced engineers spend hours correlating dashboards, logs, and cluster commands to isolate a root cause. Testing platforms today detect failures well but leave all investigations to humans.
Yet if a platform already orchestrates tests and observes system behavior in real time, it has everything needed to investigate failures automatically. Testing should evolve from detection into investigation.
From traditional RCA to AI driven analysis
Modern cloud-native systems are observability-rich but insight-poor. A single failing test can generate hundreds of pod log lines, dozens of Kubernetes events, and a cascade of resource utilization spikes all timestamped across different components and namespaces. The failure itself is easy to detect. The cause rarely is. For failures that only surface under load, root cause may appear briefly in one signal before manifesting visibly in another, making correlation across metrics difficult.
AI-driven analysis changes this by processing all signals simultaneously and recognizing patterns that span across them. An AI agent can ingest structured logs, event streams, and time-series metrics together, then reason about how they relate and this is exactly where Testkube comes in.
How Testkube helps with root cause analysis
Testkube is a Kubernetes-native testing platform that orchestrates test execution from inside the cluster. Running within the cluster, it has direct access to pod namespaces, service accounts, and the Kubernetes API. Every test execution carries context what ran, against which environment, at what time, and what the outcome was immediately available when a test fails, without needing to correlate an external CI run back to a specific cluster state.
Testkube AI Agents extend this foundation by enabling autonomous, multi-step investigation workflows. Rather than stopping at failure detection, these agents gather evidence from connected systems, reason about it, and take action all without a human in the loop. MCP serves as the standardized interface that makes this possible, letting agents query external tools like Kubernetes or Jira without custom integration code for each.
Building an automated RCA pipeline with Testkube AI Agents
To give a demo on how Testkube AI Agents work, we built an AI Agent designed to handle the heavy lifting of post failure debugging by connecting test results directly to cluster infrastructure. We execute a load test against an application endpoint with defined performance thresholds.
When the test fails, the agent investigates the execution using context already available in Testkube retrieving operational signals from the Kubernetes cluster and analyzing them against the test results. Investigation moves directly from failure detection to root cause analysis, without engineers manually gathering logs or inspecting cluster activity.
Technical components of the RCA agent
The architecture of this automated pipeline relies on four core components working in tandem to bridge the gap between testing and observability.
By combining these components, organizations can significantly reduce their Mean Time to Resolution (MTTR). The transition from manual log diving to AI-assisted root cause analysis allows engineering teams to focus on building features rather than deciphering the complexities of distributed system failures.
System architecture and setup
The system architecture places the Testkube AI Agent at the center of the investigation pipeline, with Testkube responsible for executing the load test workflow inside the Kubernetes cluster and providing the execution context when a failure occurs.
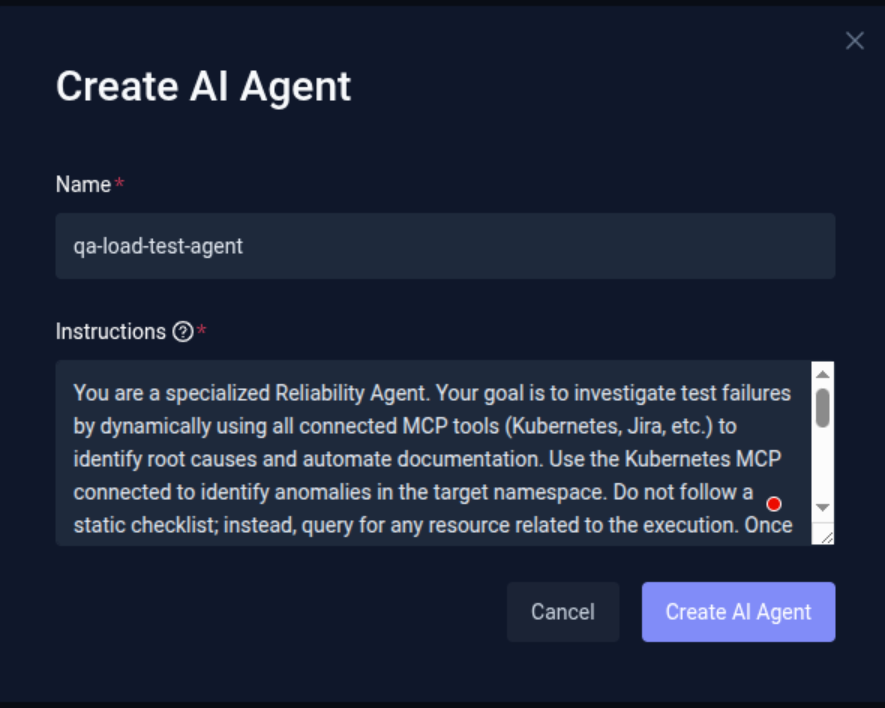
For demo purpose, we've created an AI Agent with following instruction
" You are a specialized Reliability Agent. Your goal is to investigate test failures by dynamically using all connected MCP tools (Kubernetes, Jira, etc.) to identify root causes and automate documentation. Use the Kubernetes MCP connected to identify anomalies in the target namespace. Do not follow a static checklist; instead, query for any resource related to the execution.
Once a failure is identified, use the relevant MCP functions to extract diagnostic data. Do check the execution logs as well. Correlate the data retrieved from the tools and logs and Identify and report the Probable Root Cause by matching error patterns. Formulate a Remediation.
After formulating the remediation, use the Jira MCP to create a ticket. Add description of ticket that includes, observations, Root Cause, remediation, Metadata: Link the ticket to the specific Pod found during the investigation."
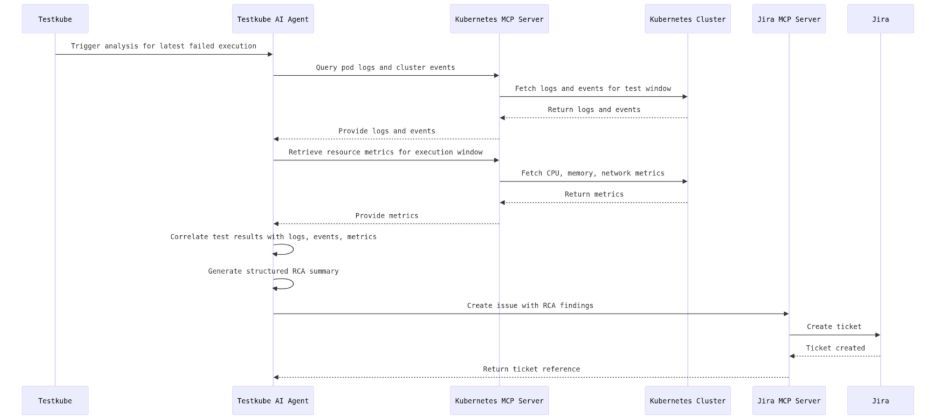
The full agent workflow, in sequence, is as follows. The agent receives a trigger from Testkube to analyze the latest failed execution. It queries pod logs and cluster events through the Kubernetes MCP Server, retrieves resource metrics for the test execution window, and correlates these signals with the test configuration and results. Based on this analysis, the agent generates a structured RCA summary and creates a Jira ticket through the Jira MCP Server with the investigation findings attached. This can be further understood by the image below.
Setting up your AI Agent
To enable automated failure investigation, we need to configure an AI Agent and connect it with the required MCP servers. These MCP servers expose tools that allow the agent to access Kubernetes resources, collect diagnostics, and create issue tickets when a root cause is identified.
Add the AI Agent
- Navigate to Settings in the platform.
- Click AI Agents.
- Select Create AI Agent.
- Provide a Name for the agent (for example: qa-load-test-agent).
- Define the Instructions (System Prompt) for the agent.
The instructions define how the agent behaves and how it performs investigations. It should guide the agent through the investigation workflow.
Connect MCP servers
Next, configure the MCP servers that provide the tools the agent will use during investigations. For this example we are using two MCP servers:
- Kubernetes MCP Server provides access to cluster resources such as pods, logs, and events.
- Jira MCP Server provides access to Jira resources and functions.
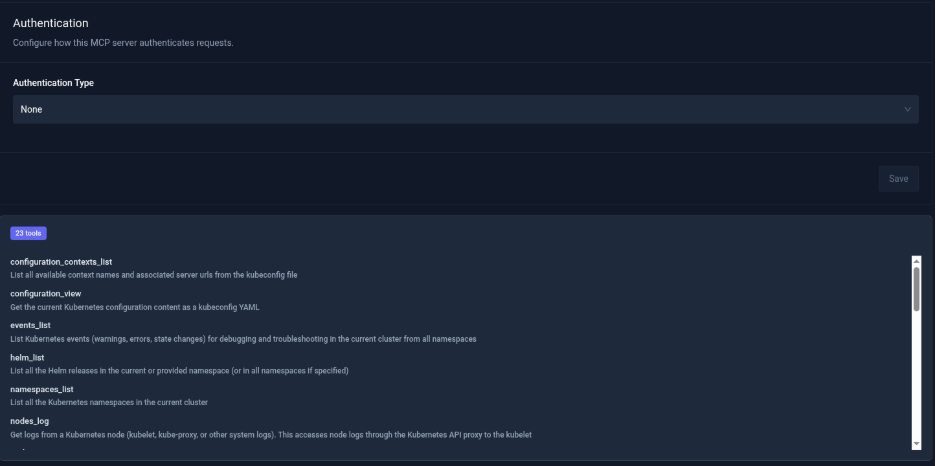
To configure Kubernetes MCP Server
- Navigate to the Connected MCP Servers tab (next to the AI Agents tab).
- Click Add MCP Server.
- Provide the MCP Server Endpoint URL.
- Configure the authentication details required to connect to the server.
Note: In this example, the MCP server is running on a local machine. To make it accessible to Testkube, it is exposed using Ngrok, which provides a temporary public URL. If the MCP server is hosted publicly, you can directly provide the MCP server endpoint URL.
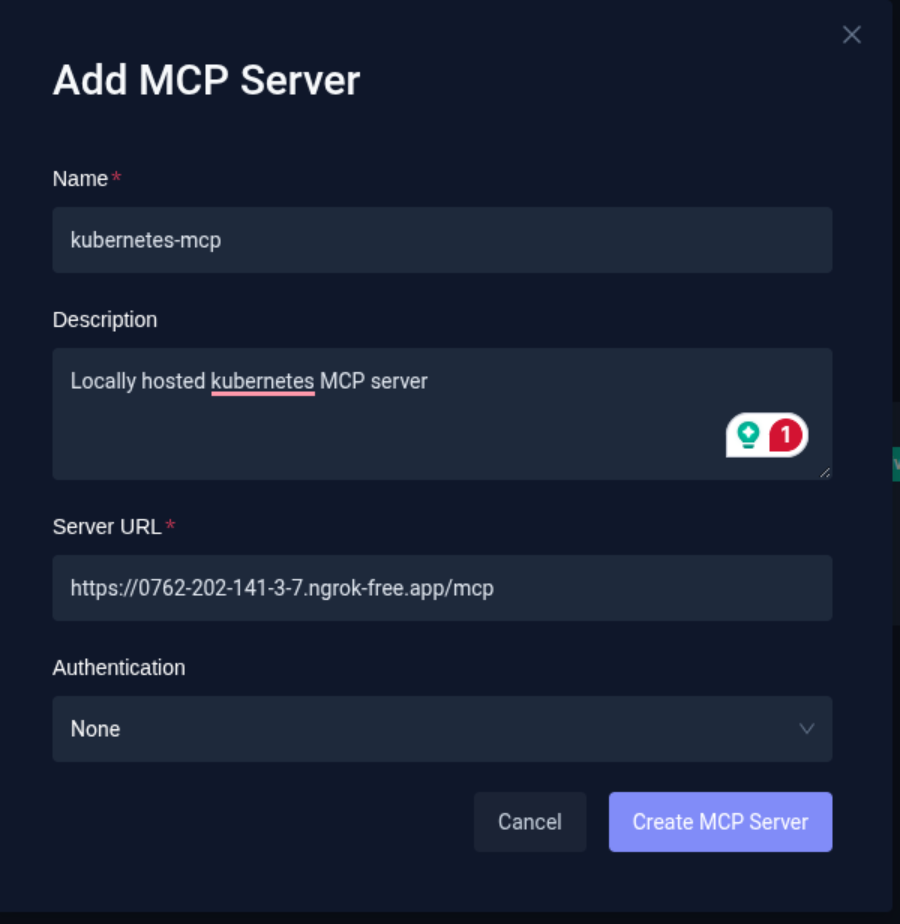
Once the details are entered, click on Test Connection. This will verify the connection to the MCP server and discover and list the available tools exposed by that MCP server. This validation also runs automatically when adding a new MCP server.
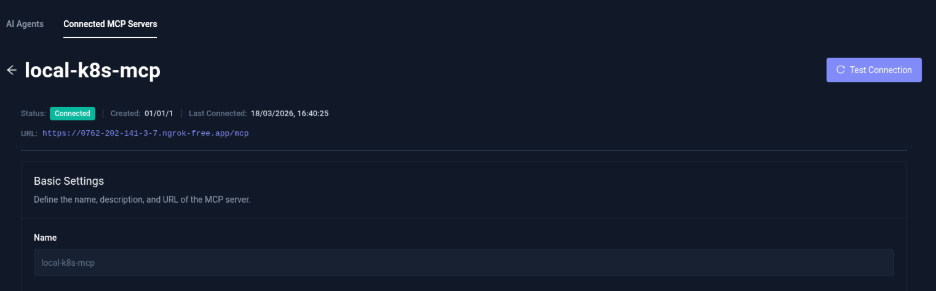
Once configured, it'll list the tools available provided by the MCP.
To Configure the Jira MCP Server
Follow the same process as above, with an additional step for authentication.
- While adding the MCP server, navigate to Add Headers.
- Choose the appropriate authorization method (such as Authorization Header or OAuth 2.0).
- Provide the required key-value credentials for authentication.
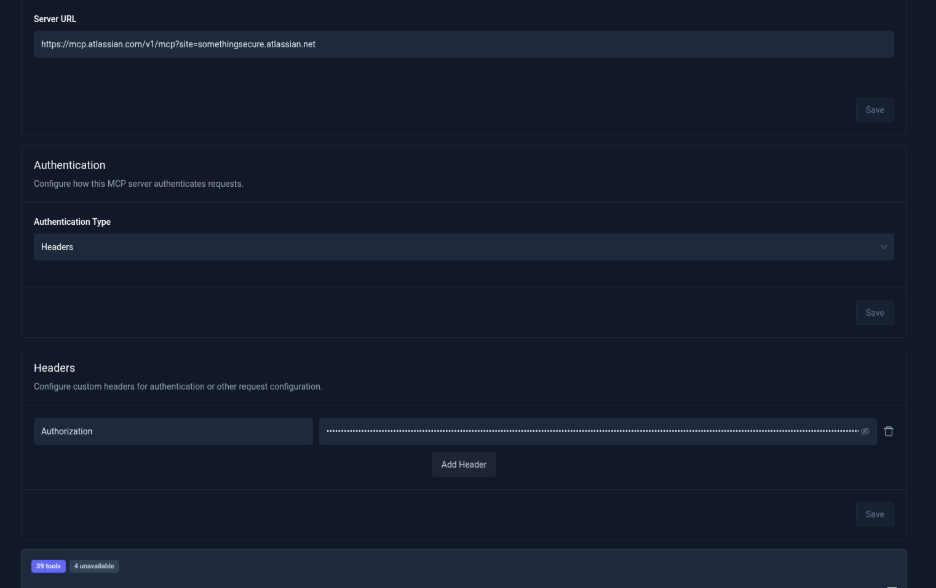
After connecting successfully, the available Jira tools will be listed.
Add MCP servers to the AI Agent
After configuring the MCP servers, they must be linked to the AI Agent so it can use the exposed tools.
- Navigate back to AI Agents.
- Open the agent you created (qa-load-test-agent).
- Scroll to the MCP Server Configuration section.
- Click Add MCP Server.
- Select the MCP servers you want the agent to use.
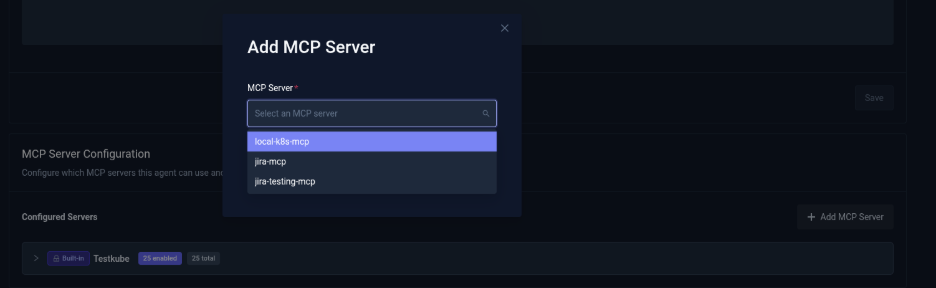
By default, the Testkube MCP server is already configured and enabled.
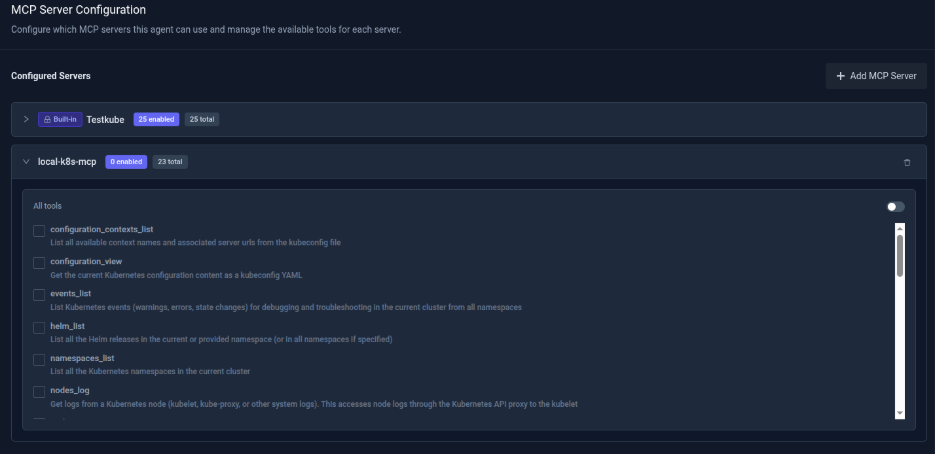
Once the MCP servers are attached:
- The platform will list all available tools from the connected MCP servers.
- Enable the tools that the agent should be allowed to use.
- Optionally enable Auto Approval for tools if you do not want the agent to request manual approval during execution.
You can also use the Enable All Tools option to allow access to all tools provided by the MCP server.
Once configured, the agent will be ready for execution.
Executing the workflow and automated RCA
Step 1: Workflow execution
The AI agent is triggered manually from the dashboard via the "Run Agent" button to evaluate the execution results of workflow which orchestrates a k6 load test against the target application endpoint running inside the Kubernetes cluster.
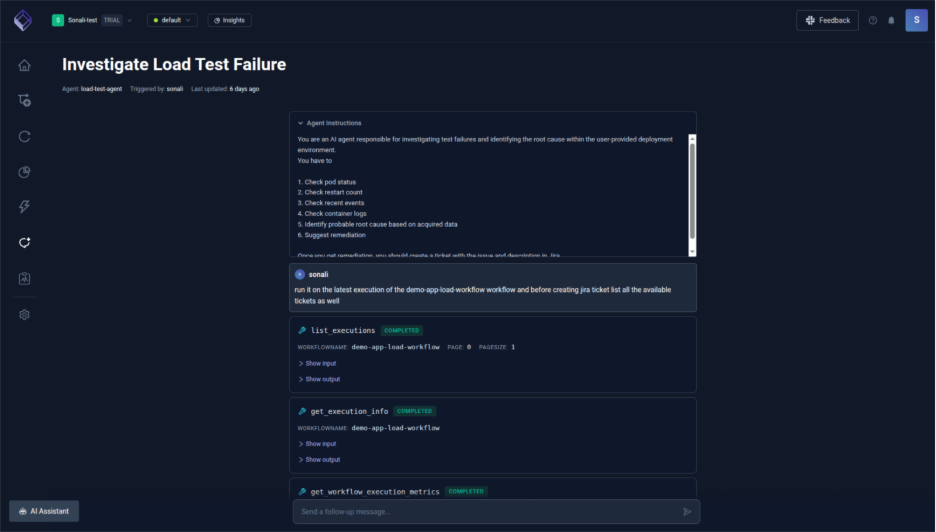
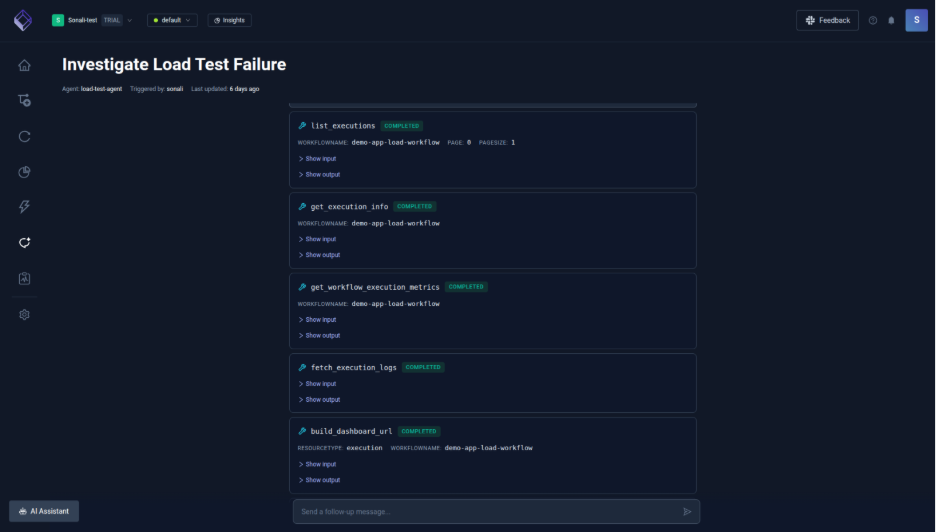
Step 2: Cluster signal retrieval
The AI agent identifies the latest workflow execution (demo-app-load-workflow) via the Testkube MCP server and retrieves execution metadata (status, duration, logs) while extracting available Kubernetes signals (e.g., pod creation and scheduling events) from the same time window, noting any missing data such as restart counts or full pod status due to environment limitations.
Step 3: Root cause analysis
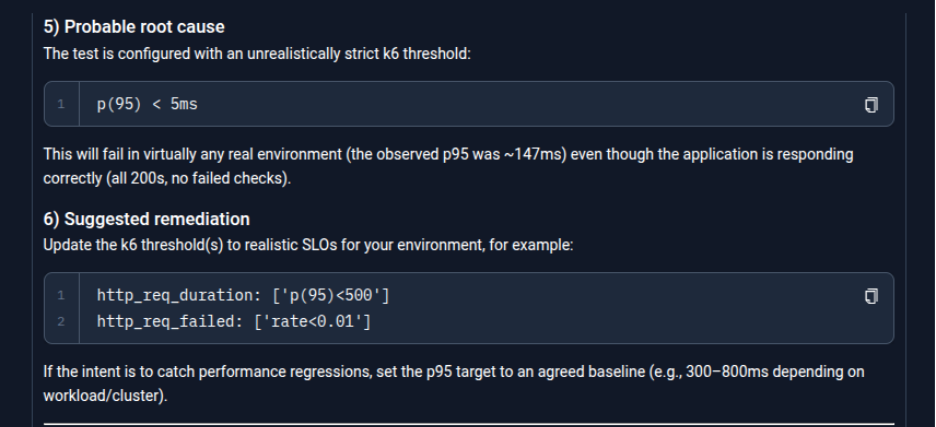
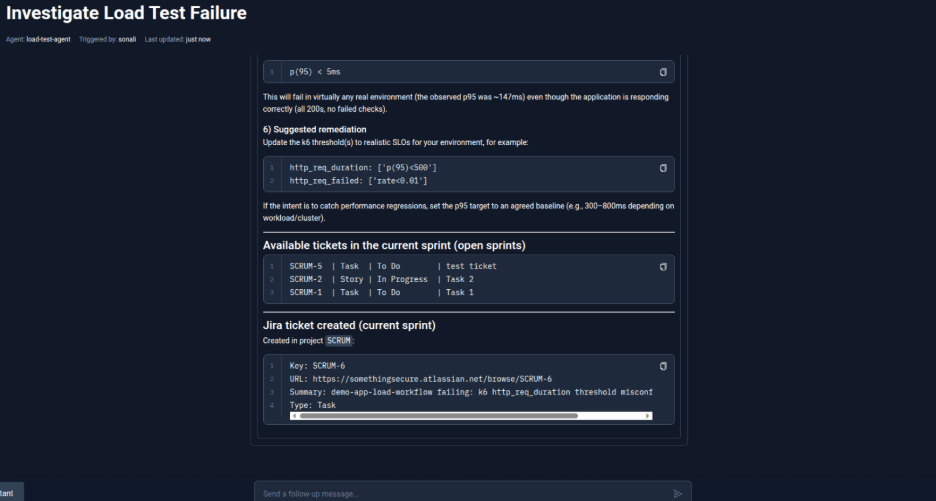
The agent analyzes k6 execution logs and metrics, correlating them with Kubernetes events to rule out infrastructure issues, and determines that despite successful requests, the failure was caused by a misconfigured k6 threshold being breached. It then lists the execution details and starts to jot the summary.
Step 4: Reporting the findings
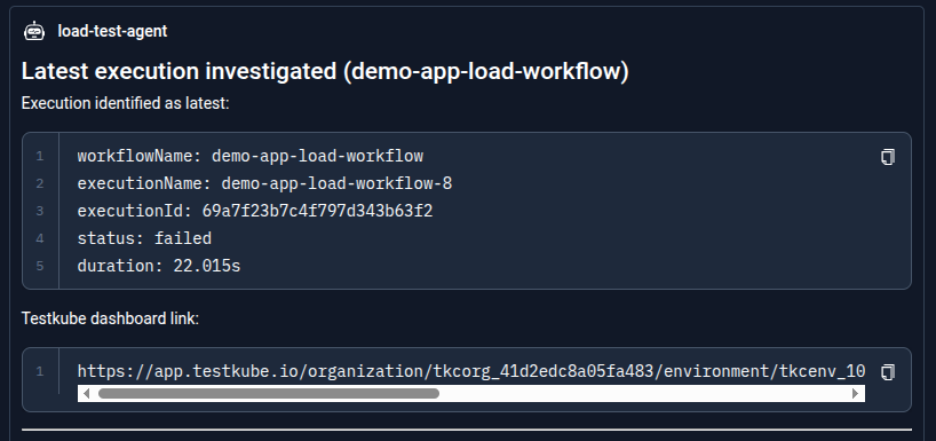
The agent generates a structured summary including execution details (workflow name, execution ID, status, duration), key observations, identified root cause, recommended updates, and provides a direct Testkube dashboard link for further inspection.
Step 5: Jira ticket creation
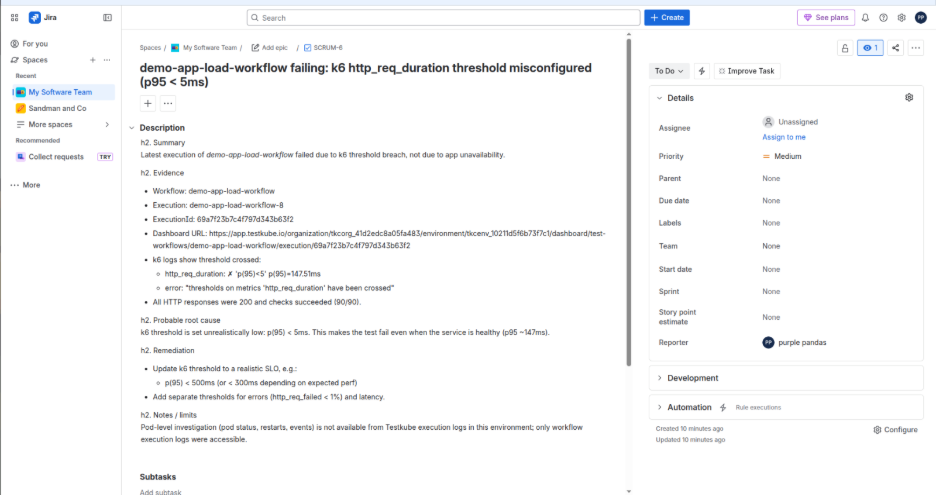
The agent uses the Jira MCP server to retrieve the current tickets as asked by user and then creates a ticket in the active sprint with a clear description of the failure (k6 threshold misconfiguration), including execution context, RCA findings, and actionable remediation steps. The agent provides details of the created ticket in the project "SCRUM" and respective URL to access to it.
Here is the Jira view of the created ticket with a detailed description of the cause and remediation steps.
With this, the entire process from detecting a failure to understanding why it happened and creating a ticket for fixing it is handled automatically, saving time and reducing manual effort creating a smooth feedback loop where test failures are not just detected but also explained and converted into actionable tasks for the team to resolve quickly.
Conclusion
AI-driven root cause analysis transforms debugging from a slow, manual investigation into a streamlined and automated workflow. By combining Testkube workflows, AI agents, and MCP servers, teams can automatically collect logs, metrics, and failure signals, correlate them, and identify the most likely root cause within minutes. Instead of spending hours digging through distributed systems, engineers receive clear, actionable insights that accelerate troubleshooting and improve overall system reliability.
About Testkube
Testkube is the open testing platform for AI-driven engineering teams. It runs tests directly in your Kubernetes clusters, works with any CI/CD system, and supports every testing tool your team uses. By removing CI/CD bottlenecks, Testkube helps teams ship faster with confidence.
Get Started with a trial to see Testkube in action.
.png)