Table of Contents
Start your free trial.
Start your free trial.

Start your free trial.


Table of Contents
Executive Summary
There's AI everywhere around us. From our CI/CD pipelines to our smartphones, we're using AI for generating Kubernetes deployment templates and even planning our holidays. The hardest part of AI isn't learning how it works. It's deciding where to point it first..
From a software development point of view, we have a bunch of tools we use day in and day out. Cursor for writing our code, GitHub Copilot for reviewing it, Testkube for validating tests, and Testkube AI agents to help you analyze and tell you what's broken.
Teams know that AI agents can help, but often stumble to get started. Not because the technology is complex, but because the starting point isn't obvious.
In this post, we'll cover exactly where Testkube AI agents add value in a testing pipeline, what you need to get started, and how to go from zero to your first working AI agent without getting lost.
What should an AI agent do in a testing pipeline?
One common mistake teams make when setting up Testkube AI agents is targeting the most powerful use case first. For instance, an agent that detects a failure, digs through the logs, checks GitHub commits, creates a Jira ticket, and updates the team. That's a real use case.
There's no harm in aiming there, but it's a complex place to begin. You need to configure external MCP servers, tune your prompts, set up guardrails, and trust the agent's output before you've had a chance to validate it.
Here are three layers at which AI agents operate:
- Observe: pull execution data and gather what matters
- Analyze: understand why something happened
- Act: do something about it
For Observe and Analyze, Testkube AI agents don't need any external tooling. Just the default Testkube MCP and a well-written prompt. This should be the starting point. Get comfortable with how the agent reasons, validate the outputs against what you already know, and only then extend into act mode with external integrations.
4 levels where AI agents add value
Testkube AI agents reside in your testing platform, not outside it. They have direct access to your workflows, executions, logs, and historical data through the Testkube MCP server. The agent already has context. Your job is to give it a clear task.
The four levels below are a practical map for doing exactly that, starting from the simplest use case and building toward the most sophisticated.
Level 1: Failure triage
When a test fails, you have a pass or fail status and a pile of logs with no immediate context for whether this is a regression, a flaky test, or an environment configuration issue. Before you've even opened the dashboard, you've already spent considerable time on mental context-switching.
This is where Testkube AI agents add the most immediate value, and it's also the easiest level to set up. A failure triage agent reads through the logs and artifacts from failed test workflows and gives you a structured output: what failed, what's likely the cause, and what you should do next.
All of this without any external MCP servers or tool integrations. Just the default Testkube MCP server and a prompt.
Start here. It's low risk and immediately useful, gives you fast feedback, and helps you understand how the agent reasons before you move on to more complex scenarios.
Level 2: Pattern recognition across executions
The most difficult failures to catch aren't the ones that always fail. They're the ones that fail sometimes. They may pass in CI, fail in staging, and pass again on rerun. These are the failures that erode your confidence in your test suites without you ever quite knowing why.
Pattern recognition is where AI excels. Testkube AI agents can analyze a test workflow's history, aggregating failure data, identifying which tests are flaky, and separating genuine failures from environmental issues.
This is the kind of analysis that would take an engineer considerable time to do manually. The setup follows the same approach as Level 1: just a richer prompt with a broader scope.
Level 3: Workflow health and visibility
The levels we've covered so far are reactive: when something fails, the agent responds. Level 3 is where you shift from reactive to proactive.
A workflow health and visibility agent looks beyond individual test execution logs. It captures and analyzes the complete picture: workflow coverage, execution frequency, resource usage, and trends over time. This is the agent that tells you a workflow hasn't run in 23 days, that three of your most critical tests have a 40% pass rate over the last two weeks, or that one workflow is consuming disproportionate resources relative to what it's actually testing.
This level is particularly useful for platform engineering teams managing testing infrastructure across multiple teams and environments.
Level 4: Cross-system correlation
All previous levels work within your Testkube environment. Level 4 is where things get more interesting. This is where you integrate your AI agents with external systems using MCP servers.
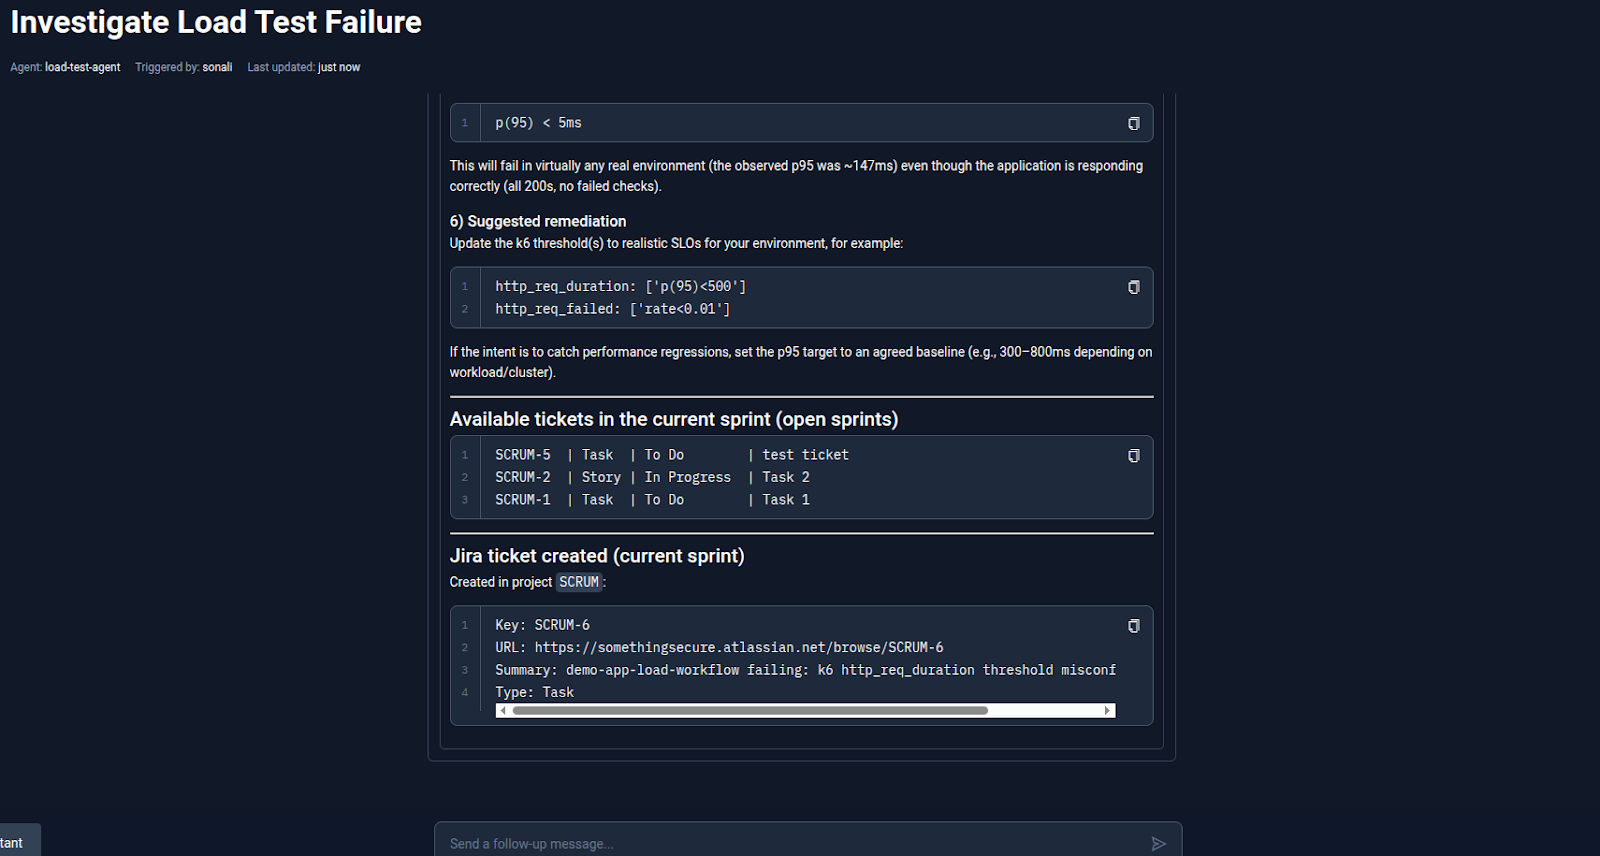
Imagine a scenario where a test fails and instead of stopping at the logs, the agent checks recent commits on GitHub to see if a code change caused the failure, queries your observability stack to check for infrastructure events at the same time, or correlates it with a production alert from PagerDuty. The agent can now move across your testing data and the rest of your engineering context to give you a clearer picture.
This level also requires real setup: configuring external MCP servers, tuning prompts for multi-source reasoning, and deciding how much autonomy the agent should have when it finds something actionable.
Get solid value from the first three levels before you invest here.
Building the right agent
The four levels tell you where to start. What they don't cover is how to make the agent good at the job. That comes down to how you write the prompt and what tools you give the agent access to. These are also the two things that are easiest to get wrong the first time.
A Testkube AI agent is only as good as the instructions you provide. You need a name, a prompt, and MCP server access. The real work is in the prompt. Here are a few tips for getting good results consistently.
Give the agent a role
Start your prompt with a role definition. That shapes how the agent reasons and what it prioritizes in its response.
Weak: Analyze this test failure
Strong: You are a QA engineer specializing in Kubernetes-native testing. You have access to Testkube execution data including logs, artifacts, and workflow history.
The second version tells the agent what lens to use, which produces a more structured and actionable response.
Be specific about what you have
Don't let the agent guess. If you're running the agent to analyze a failed test workflow, provide the execution ID and workflow name explicitly. Or better yet, let the agent ask the user for these details before it starts working.
Weak: Look at recent failures and tell me what's wrong.
Strong: Analyze the last 10 executions of workflow 'payment-service-e2e'. Identify which tests failed more than once and whether there's a pattern in the failure messages.
Vague inputs produce vague outputs. The more specific you are, the more actionable the result will be.
Tell the agent what output you want
Specify the output format upfront. This prevents the agent from producing more text than you need to parse yourself.
Weak: Tell me about the failure.
Strong: Summarize in 3 bullet points: what failed, the most likely cause based on the logs, and the one thing I should check next.
Scope the tools you give it
When configuring MCP servers and tools, start with fewer options and be deliberate. You can enable or disable specific tools for each MCP server from the Testkube AI agent dashboard. An agent with access to fetch_execution_logs, get_execution_info, and list_executions will stay focused. An agent with access to everything will sometimes wander.
Be prepared to iterate
Your first prompt won't be perfect, and that's expected. After each agent run, review the output: did it answer your query, was it scoped to the task? Adjust the prompt accordingly. Within a few iterations, you'll have something you can use repeatedly to generate reliable, actionable results.
A practical starting path: crawl, walk, run
Now that you know the levels and how to write better prompts, here's a concrete sequence for putting it all into practice without getting overwhelmed.
Week 1: Crawl
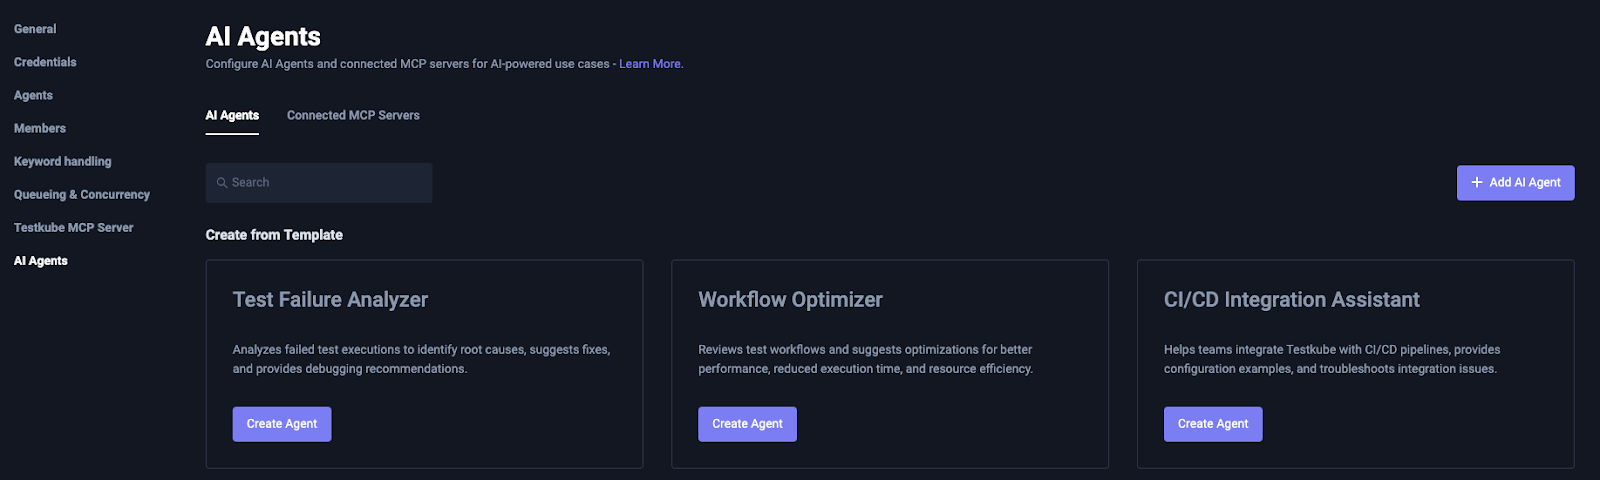
Pick one test workflow that fails with some regularity. Start by using the Testkube Test Failure Analyzer agent that is provided out of the box. It can automatically identify, and in the best scenario even fix, code or configuration issues related to failures.
Enable it by clicking the "Create Agent" button under Test Failure Analyzer. The agent comes ready with a prompt and Testkube MCP server access already configured. Use it manually via the "AI Analyze" button on your next failure. Read the output and compare it against what you already know about that failure.
Week 2: Walk
Try two things in parallel: automate what's working, and expand what you're testing. Connect the agent to a failure trigger so it runs without manual invocation. Also start using an agent for pattern recognition by providing a broader scope and a longer time window, and see how it handles the increased complexity.
If you're ready to go further, try connecting a simple hosted MCP server like Slack for pushing analysis to your team's dedicated channels.
Month 2: Run
You now have automated triage, pattern recognition across executions, and a solid understanding of how to scope and prompt agents. This is when external MCP servers stop being intimidating. Build a cross-system agent that correlates test data with code changes or infrastructure events. Extend it with Slack or Jira for routing output and creating tickets.
Check out our blog post on using the Testkube AI agent with the Argo CD MCP server, which correlates test workflow logs with application and cluster-level events.
Conclusion
The teams that get the most from AI agents aren't the ones who planned the most elaborate setup. They're the ones who started with something simple, learned how the agent reasons against their actual data, and built from there.
Not with a multi-system correlation agent integrating GitHub and PagerDuty. Just a triage agent that read a failure and said what to do next.
You don't need external MCPs to get started. You don't need to solve your hardest test workflows first. You need one workflow, one prompt, and fifteen minutes to configure your first triage agent.
Build your first agent today - follow the step-by-step guide in Building Your First Testkube AI Agent, or go straight to the AI Agents documentation to start configuring.
About Testkube
Testkube is the open testing platform for AI-driven engineering teams. It runs tests directly in your Kubernetes clusters, works with any CI/CD system, and supports every testing tool your team uses. By removing CI/CD bottlenecks, Testkube helps teams ship faster with confidence.
Get Started with a trial to see Testkube in action.
.png)