
Table of Contents
Start your free trial.
Start your free trial.

Start your free trial.



Table of Contents
Executive Summary
A failed CI test tells you something went wrong, but not necessarily why. For Platform and DevOps teams, the same red job could point to a code regression, an environment problem, or an issue with the system running the test.
Consider a k6 load test that fails its latency threshold even though the application code and deployment haven't changed. At first glance, it looks like an application performance issue: the test is reporting higher latency, so something in the application must be slow. But when you investigate further, you find that the load-generator pod is being CPU-throttled because of its own resource limit. The application is behaving normally, and the k6 test itself is running as expected. The problem is with the environment in which the test is running, which is affecting the results.
This is where looking at the failure domain matters. The code may be responsible for a genuine regression, the environment may introduce conditions that affect the test, or the runner may have a problem executing it correctly. All three can produce the same red test, but they require very different fixes.
In this post, we'll look at how to distinguish between them, what signals and execution evidence can help with failure attribution, why simply rerunning a test isn't always enough, and how Testkube can help bring test and execution context together. The goal is to move beyond "the test failed" and understand which layer actually failed and why.
Code, environment, or runner?
The three failure domains can produce similar symptoms, but they require very different investigations.
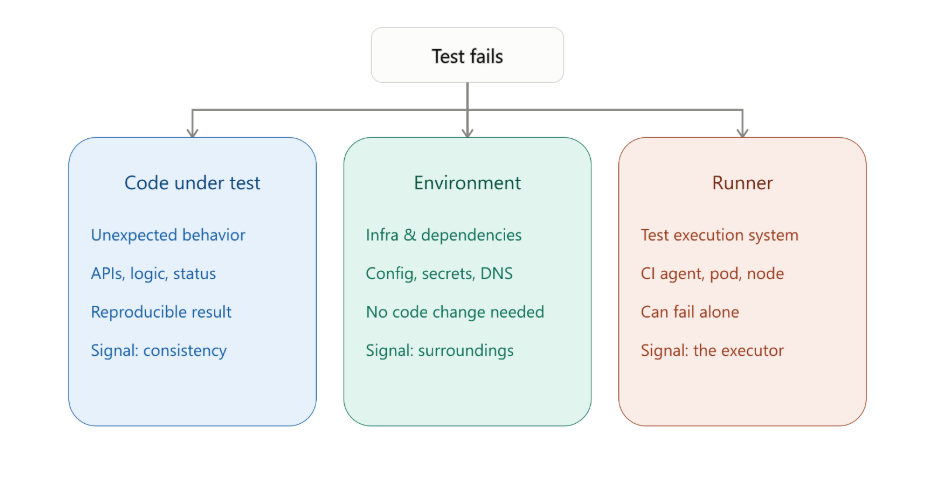
Code under test
The application or service does not behave as the test expects. A code-related failure should generally be reproducible when the same application version is tested under equivalent conditions. It could be an API returning an unexpected response, a regression in business logic, an incorrect status code, or an application error introduced by a recent change.
The important signal is consistency. If the same application behavior appears across different runners and environments under comparable conditions, the application becomes a stronger candidate for investigation.
Environment
The application may be correct, but something around it affects the test. The environment includes the infrastructure and dependencies surrounding the application, such as:
- Configuration and secrets
- External services and dependencies
- Networking and DNS
- Kubernetes resources
- Service readiness
- Deployment state
- Resource availability
- Database or message-queue availability
An environment-related failure may therefore appear even when the application code has not changed.
Runner
The test execution system itself introduces the problem. The runner could be a CI agent, Kubernetes pod or node, container runtime, filesystem, installed dependency, or runner-specific configuration. This distinction between environment and runner is particularly important:
- The environment is the context in which the application is being tested.
- The runner is the infrastructure or process responsible for executing the test.
That means a test can fail even when the application code is unchanged and the target environment is healthy, simply because the test was executed under a problematic runner.
For example, if a k6 process running inside a Kubernetes pod is CPU-throttled, the load generator may not generate traffic or measure latency in the way the test expects. The application could still be behaving normally. The failure is not necessarily "the Kubernetes environment" in general. The evidence may point specifically to the infrastructure executing the test.
Recognizing the failure pattern
The most useful evidence often comes from looking at what the failure follows. Does it follow a particular code version? Does it occur only in one environment? Or does it follow a particular runner or node?
This way of looking at failures can narrow the investigation before anyone starts changing the test.
When the failure points to the code
Failures that consistently reproduce across different runners and environments are stronger indicators of an application or test-code problem. A failure appearing after a code change, while the same execution conditions previously passed, provides another useful signal for code attribution.
For example, imagine an API test that expects a 200 response but starts receiving a 500. You run the same test:
- On two different runners
- Against two equivalent environments
- Using the same test configuration
If the application returns the same error each time, the runner becomes a less likely explanation.
Other signals that can point toward the code include:
- Assertion failures that consistently reproduce
- Incorrect API responses
- Unexpected application behavior
- Application exceptions or errors
- Failures that begin after a specific application change
- The same failure occurring across multiple execution contexts
This does not mean every reproducible failure is automatically an application bug. Test logic, test data, or a shared dependency can still be responsible.
The important point is that the failure pattern gives you a direction for investigation.
When the failure points to the environment
A test that passes locally but fails against a deployed application can indicate differences in configuration, dependencies, networking, service readiness, Kubernetes state, or available resources. Failures that occur only in one environment are another useful signal.
For example, suppose an API test passes against one staging environment but consistently fails against another. Instead of immediately modifying the test, compare what is different between those environments:
- Are the application versions identical?
- Are configuration values different?
- Are all dependencies available?
- Is the service fully ready?
- Are there network or DNS differences?
- Are resource limits different?
- Is the database or external service healthy?
Deployment timing can also provide useful context. A test failure immediately following a deployment may be related to application state, configuration, dependency availability, or readiness. A service might technically be running while one of its dependencies is still unavailable. This is why the test result should be considered alongside deployment and environment information.
For a deeper discussion of environment-related failures, see "Why Your Tests Pass Locally but Fail in CI."
When the failure points to the runner
The strongest runner signal is when the same test, against the same application and environment, behaves differently depending on where it executes. Runner problems can vary depending on the execution model.
Long-lived CI agents can develop problems over time, including:
- Stale dependencies or runtime versions
- Filesystem issues
- Permission problems
- Resource exhaustion
- Leftover processes or artifacts
Pod-per-execution runners introduce a different set of possible issues:
- CPU or memory limits that are too low
- CPU throttling
- Container termination
- Node pressure
- Scheduling delays
- Changed runner images
- Runtime or dependency differences
Returning to the k6 example: the application is unchanged. The target environment is unchanged. But the load-generator pod is CPU-throttled because of its resource limit. The latency threshold is therefore missed while the system responsible for generating the load is constrained. The failure follows the runner, not the application.
This is why a rerun on another runner should not be treated simply as another attempt to make the test pass. It can be a diagnostic comparison. If the same test, against the same application and environment, passes after moving to a different runner, that difference is evidence worth investigating.
What evidence makes the difference?
Once a failure occurs, the goal is to connect the test result with the state of the systems involved. A test result tells you what the test observed. Application, environment, and runner signals help explain why it observed it.
Test and application evidence
Test output, assertions, exit codes, execution duration, stack traces, and artifacts establish what the test actually observed. Application logs and health signals provide another perspective: what was happening inside the application when the test ran? Useful application evidence includes:
- Application logs and errors
- Response payloads
- HTTP status codes
- Deployment versions
- Application health
- Error rates
- Restarts
- Relevant application events
Timing also matters. A test failure should be correlated with application deployments, errors, restarts, or other events around the same time rather than being investigated in isolation.
For example, if a latency test starts failing immediately after a service deployment, the deployment becomes relevant evidence. If the application logs show no corresponding errors but the runner shows CPU throttling, the investigation has another direction to follow.
Environment evidence
For Kubernetes-based systems, useful environment evidence can include:
- Pod status and events
- Node information
- Readiness state
- Restarts and OOMKills
- Evictions
- Scheduling problems
- CPU and memory usage
- Networking issues
- Dependency availability
Configuration and deployment information should also be considered, particularly when failures are isolated to one environment. There is an additional complication when tests run inside the cluster: the runner and the environment may share the same node conditions. A node under resource pressure could affect both the application and the test runner. That makes attribution more difficult unless execution metadata is available. The key question becomes:
Does the failure follow where the test pod landed, or the state of the service it called?
If the failure follows a specific runner pod or node, investigate the runner. If it follows the target service or environment regardless of where the test runs, investigate the environment.
Runner evidence
Runner identity and execution metadata are essential when determining whether a failure follows a particular CI agent, container, pod, or node. Useful runner evidence includes:
- CPU and memory usage
- Resource requests and limits
- CPU throttling
- Runtime and container state
- Installed dependencies
- Filesystem access
- Process-level errors
- Runner configuration
- Node conditions
- Container termination events
The goal is not to collect every possible metric. It is to have enough context to compare executions. Consider two executions of the same test. The application version, environment, test data, and test configuration are identical. The only meaningful difference is the runner. If one execution fails while the other passes, the runner difference becomes an important part of the investigation. This is where having test execution data together with its execution context becomes useful.
Centralizing test evidence with Testkube
Testkube centralizes test execution data and observability, allowing the test result to be investigated alongside the context in which the test actually ran. The Resource Usage view on each execution tracks CPU and memory for the runner pod over the full run, along with which runner and agent executed it.
Here is the k6 example from earlier. We ran a single Testkube workflow twice on the same agent (testkube-runner), changing only the CPU limit in the workflow's resource configuration. Here is the workflow we used for this.
kind: TestWorkflow
apiVersion: testworkflows.testkube.io/v1
metadata:
  name: k6-runner-cpu-limit-demo
  namespace: lakshmi-testkube
  labels:
    tool: k6
spec:
  config:
    cpuLimit:
      description: CPU limit for the k6 load-generator pod
      type: string
      default: 100m
  content:
    files:
      - path: /data/load.js
        content: |
          import http from 'k6/http';
          import { check, sleep } from 'k6';

          export const options = {
            vus: 30,
            duration: '90s',
            thresholds: {
              http_req_duration: ['p(95)<30'],
              checks: ['rate>0.99'],
            },
          };

          export default function () {
            const res = http.get(__ENV.TARGET);
            check(res, { 'status is 200': (r) => r.status === 200 });
            sleep(0.05);
          }
  services:
    web:
      image: nginx:1.27-alpine
      readinessProbe:
        httpGet:
          path: /
          port: 80
        periodSeconds: 1
  steps:
    - name: Run k6 load test
      run:
        image: grafana/k6:latest
        env:
          - name: TARGET
            value: http://{{services.web.0.ip}}/
        args:
          - run
          - /data/load.js
        resources:
          limits:
            cpu: '{{config.cpuLimit}}'
            memory: 512Mi
          requests:
            cpu: 50m
            memory: 128Mi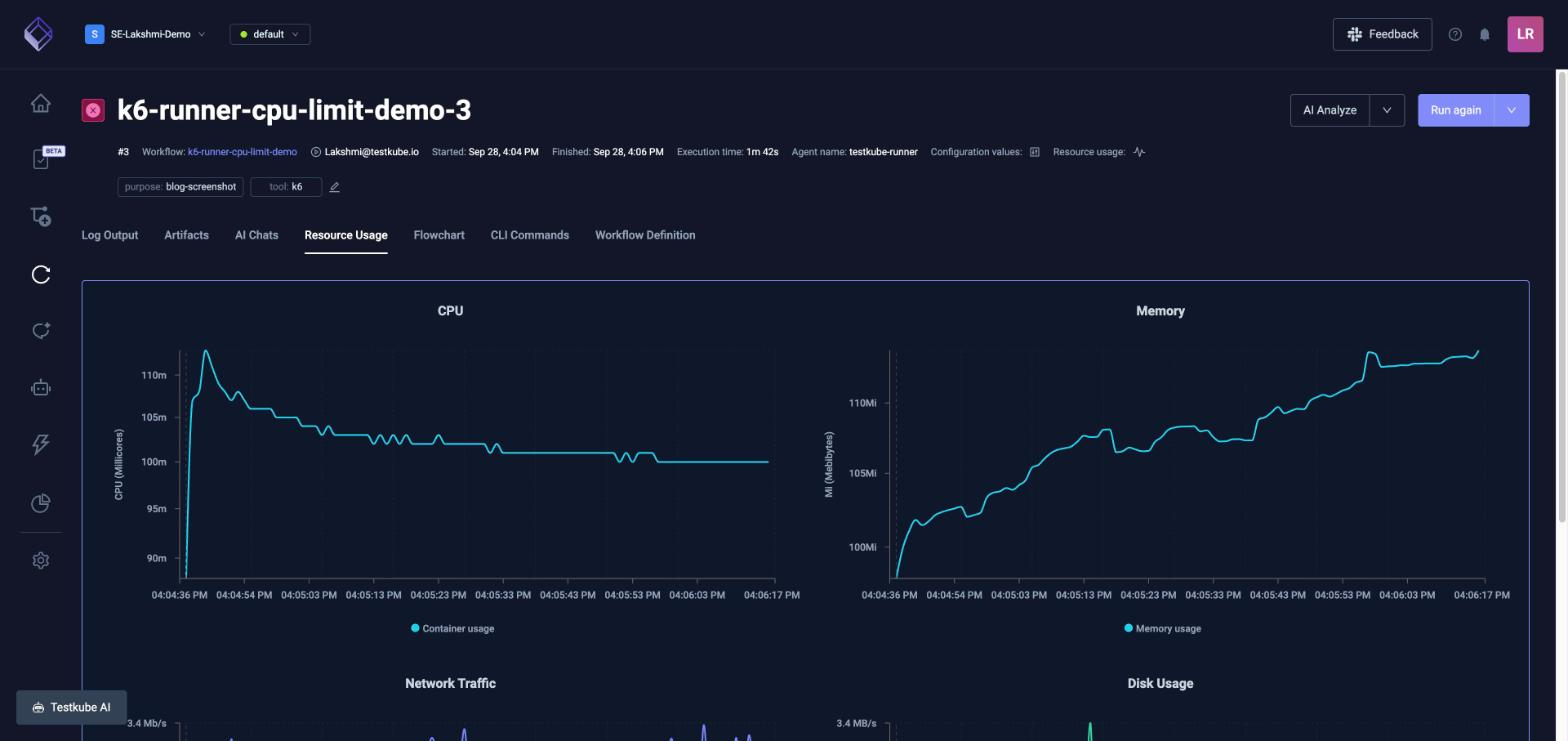
With a 100m CPU limit on the runner pod, usage spikes briefly at startup, then sits pinned at its limit for most of the execution. Every request in the run returned a 200, but p95 latency came in at 99.6 ms against a 30 ms threshold, so this run failed on latency, not on functional correctness.
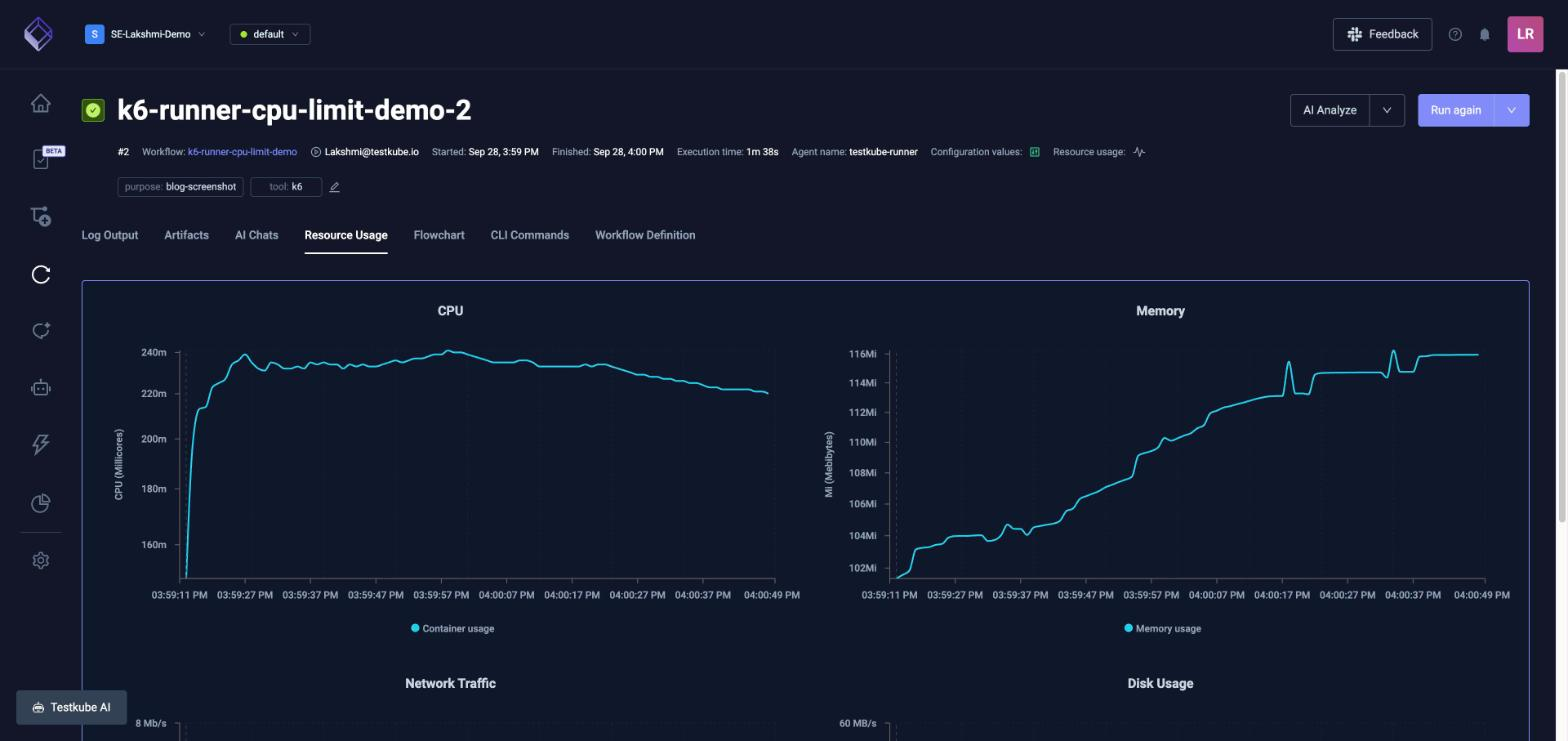
When we updated the limit to 1000m on the same agent, the same workflow used about 235m of CPU, well under the new ceiling, and p95 dropped to 3.5 ms.
Instead of stopping at:
"The k6 test failed its latency threshold."
the investigation can ask:
"What was happening on the system executing k6 when that threshold was missed?"
Here, the chart answers that directly: CPU usage pinned at its configured limit for the length of the run. Nothing about the test or the application changed between these two executions. The only variable was the CPU limit, and the execution header confirms both runs used the same agent. This is the comparison the rest of this article has been building toward: instead of asking whether the test can be made to pass, the execution context shows exactly what changed between the passing and failing runs.
This same context is useful when comparing executions across environments as well as runners. The purpose is not to assume that every test failure is caused by infrastructure. It is to make the execution context available so that infrastructure-related causes can be considered alongside application and test evidence.
Testkube brings these signals together. An AI Analyze action sits directly in the execution view to help teams investigate the available context and surface potential causes. The important part is that AI does not replace the underlying evidence. The quality of the investigation still depends on having the relevant execution, application, environment, and runner context available.
Analyzing why the test failed
The goal of failure attribution is to move from a generic result to a more useful explanation. A red CI job tells you that something failed. The next step is determining what the failure follows.
A practical diagnostic checklist
The final attribution question is simple:
What does the failure follow?
If it follows the code, investigate the code. If it follows a particular environment, investigate the environment. If it follows the execution context, investigate the runner. This does not provide an instant diagnosis, but it gives the investigation a more useful starting point.
Why rerunning alone doesn't solve attribution
A rerun can tell you whether the failure reproduced. It does not automatically tell you why it happened. Repeating the same execution on the same runner can reproduce a runner problem without revealing that the runner is responsible. Conversely, a test that passes on a rerun may still have encountered a transient environment or execution issue.
Changing the execution context provides stronger attribution evidence. For example, compare:
- The same test
- Against the same application version
- In the same environment
- With the same configuration
- On a different runner
If the result changes, that difference becomes part of the investigation. The same principle can be applied to nodes, environments, or deployment versions. The goal is to move from:
"Can I make the test pass?"
to:
"What changed between the passing and failing executions?"
That distinction matters because making a test green does not necessarily resolve the underlying failure.
The role of test orchestration
Reliable failure attribution requires more than a pass/fail result buried inside a CI job. The execution should retain information about:
- What test ran
- Which version or configuration was tested
- Where it ran
- Which environment it targeted
- Which runner executed it
- What happened during execution
Without this context, engineers may have to jump between CI logs, Kubernetes dashboards, application logs, and infrastructure tooling to reconstruct what happened. With the context attached to the execution, comparisons become much easier. For Platform and DevOps teams, Testkube's role here is specifically around visibility into test executions and their execution context. The goal is not to turn the discussion into generic CI orchestration, but to make failure investigation more grounded in execution evidence.
For deeper coverage of Kubernetes-specific failure patterns, see "Why Your Kubernetes Tests Are Flaky (It's Not the Code)."
Conclusion
A red test is a starting point for finding the cause. The first question should be: Did the code fail, the environment fail, or the runner fail? Code failures tend to follow the application, environment failures follow a particular deployment or environment, and runner failures follow the execution context. The key is having enough evidence to tell them apart. Before changing the test or rerunning the job, ask: What does this failure actually follow?
Testkube brings test results and execution context together, helping Platform and DevOps teams compare runs and investigate whether a failure comes from the code, environment, or runner. See how Testkube can help you move from "test failed" to "failed because."
Frequently asked questions
{{banner-get-started}}
About Testkube
Testkube is the open testing platform for AI-driven engineering teams. It runs tests directly in your Kubernetes clusters, works with any CI/CD system, and supports every testing tool your team uses. By removing CI/CD bottlenecks, Testkube helps teams ship faster with confidence.
Get Started with a trial to see Testkube in action.