

Table of Contents
Start your free trial.
Start your free trial.
Start your free trial.


Table of Contents
Executive Summary
In the rapidly evolving landscape of software development, teams often prioritize rapid feature deployment through CI/CD pipelines and automated workflows. However, it’s not just about pushing code faster. It’s about maintaining system reliability and catching issues before they impact users.
When mission-critical tests fail or show degraded performance, teams must know about it immediately. That’s where the need for effective alerting and response systems arise, which help maintain high availability and operational awareness. PagerDuty is one such solution for incident management, providing teams with the tools to address and resolve issues quickly.
This tutorial explores how integrating PagerDuty with Testkube can enhance your team's response to critical test failures, ensuring your development cycle remains fast and reliable.
Alerting Via Webhooks
Throughout the evolution of technology, numerous methods have enabled systems to communicate seamlessly. From various protocols to services, the goal has always been to facilitate data transfer across disparate systems efficiently.
Webhooks stand out as a powerful mechanism for system interaction. They serve as digital informants, alerting services to specific events. Essentially, a webhook endpoint acts as a listener for one system, ready to receive data transmitted by another.
In the context of Testkube, Webhooks are instrumental. They empower you to effortlessly inform other services about test-related activities. For example, setting up a Slack webhook with Testkube allows for the automatic dissemination of event notifications, bridging the gap between test execution and team communication.
Key Components of a Webhooks Trigger in Testkube:
- Events: These are the specific occurrences within Testkube you wish to monitor, such as "test-start" or "test-fail". Selecting relevant events allows for targeted notifications.
- Source: Indicates the origin of the event, whether it's an individual test or a collection of tests within a TestSuite.
- Destination: The webhook endpoint or the digital address to which Testkube sends the notification.
For additional information on webhook components, please see our Webhook documentation.
Advantages of Implementing Webhooks
- Instant Alerts: Stay informed with real-time notifications about your tests' outcomes, enabling immediate action.
- Automated Workflows: Trigger specific actions based on test results, such as sending detailed emails after a failure, streamlining your response mechanism.
- Seamless Integration: Webhooks facilitate communication between Testkube and various tools or services like Slack for messaging or Grafana for monitoring, effortlessly fitting into your existing workflows.
By utilizing webhooks within Testkube, you can significantly enhance test observability and automation, making your testing processes more efficient and integrated.
Integrating Testkube With PagerDuty
PagerDuty is an incident response management and alerting platform for DevOps teams managing critical operations. It provides real-time alerts and escalates incidents to the appropriate personnel. By automating the incident response workflow, PagerDuty ensures that incidents are addressed promptly and efficiently, reducing downtime and improving overall system reliability.
Being the extensive tool that it is, there are a few components that we must be aware of for the purpose of this tutorial:
- Services: These are applications/services within an organization that are monitored. These are connected to monitoring tools that trigger alerts based on predefined rules and thresholds.
- Integrations: Integrations allow PagerDuty to connect with other monitoring and collaboration tools seamlessly. This allows it to collect data from multiple sources and manage them centrally.
- Incidents: These are events that indicate something has gone wrong. When a monitoring tool detects an issue, it sends an alert to PagerDuty, which creates an incident that can be categorized and assigned to different personnel.
Apart from these, PagerDuty has advanced mechanisms that allow teams to send emails, calls, SMS, and push notifications to notify designated personnel about the incident. You can read more about PagerDuty and its features here.
Creating a Service & Integration
The first and foremost step is to create a service in PagerDuty. Creating a service in PagerDuty is fairly simple, and you can create one in a few minutes.
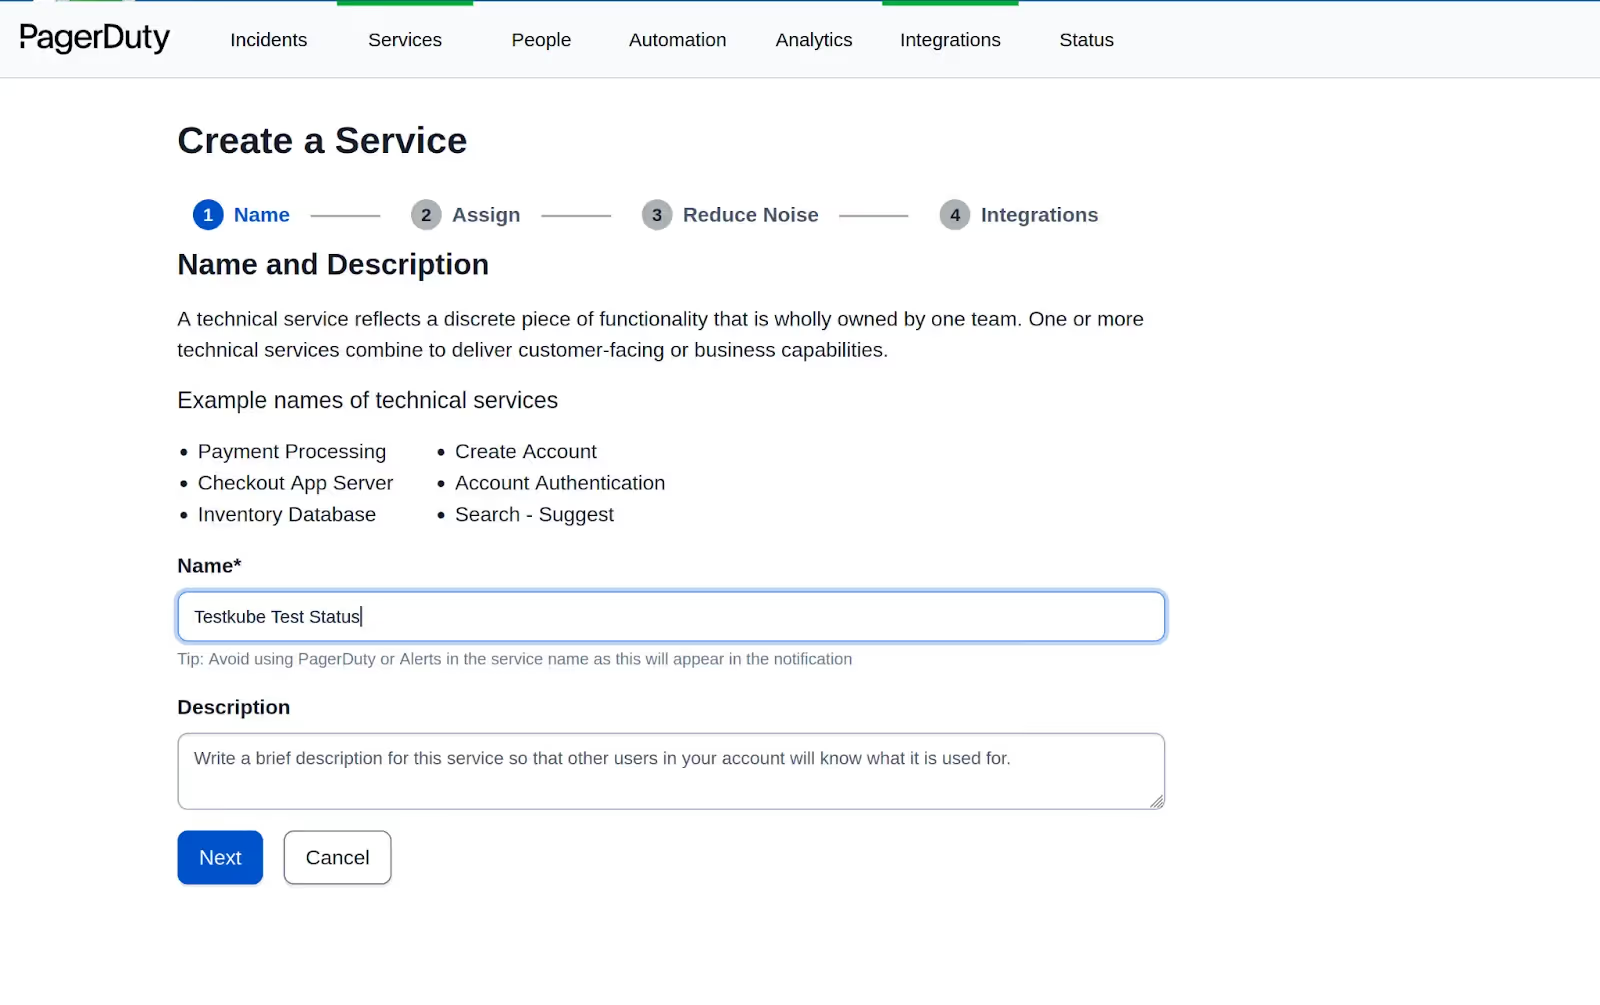
Once you've created your service, the next step is to create an integration. This integration essentially enables PagerDuty to receive alerts from other services or tools, such as Testkube.
By default, PagerDuty provides support from multiple tools. However, in the case of Testkube, we’ll use their Events API V2 integration, which will allow us to send custom events.

After selecting this, you will be given the configurations to create the webhook in Testkube. It will share details like the integration key and integration URL for change and alert events, along with an example of using the API.
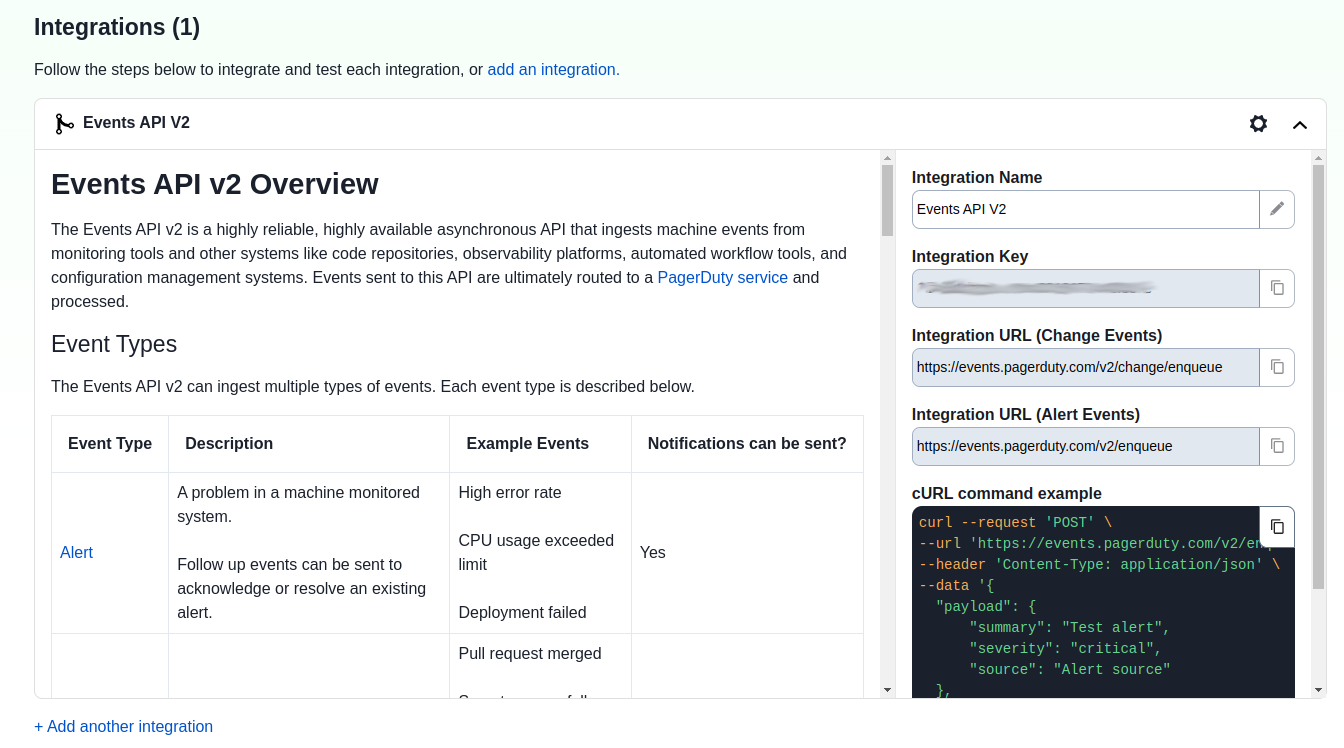
Note that the PagerDuty events API expects JSON input in a specific format when processing alerts. With this, we have configured PagerDuty to receive alerts from Teskube. Now, let's set up a Webhook in Testkube.
Creating a Testkube Webhook
Creating a webhook trigger in Testkube is straightforward. You can create Webhooks using the dashboard as well as the CLI. We’ll be using the dashboard to show you how it works.
Using Dashboard
We’ll set up a webhook for PagerDuty using the dashboard. This webhook will trigger on the test-end-failure event and send the data to the PagerDuty webhook endpoint that we got in the previous step (Integration URL).
To create a Webhook, follow these steps:
- From the left navigation menu, select “Integrations”.
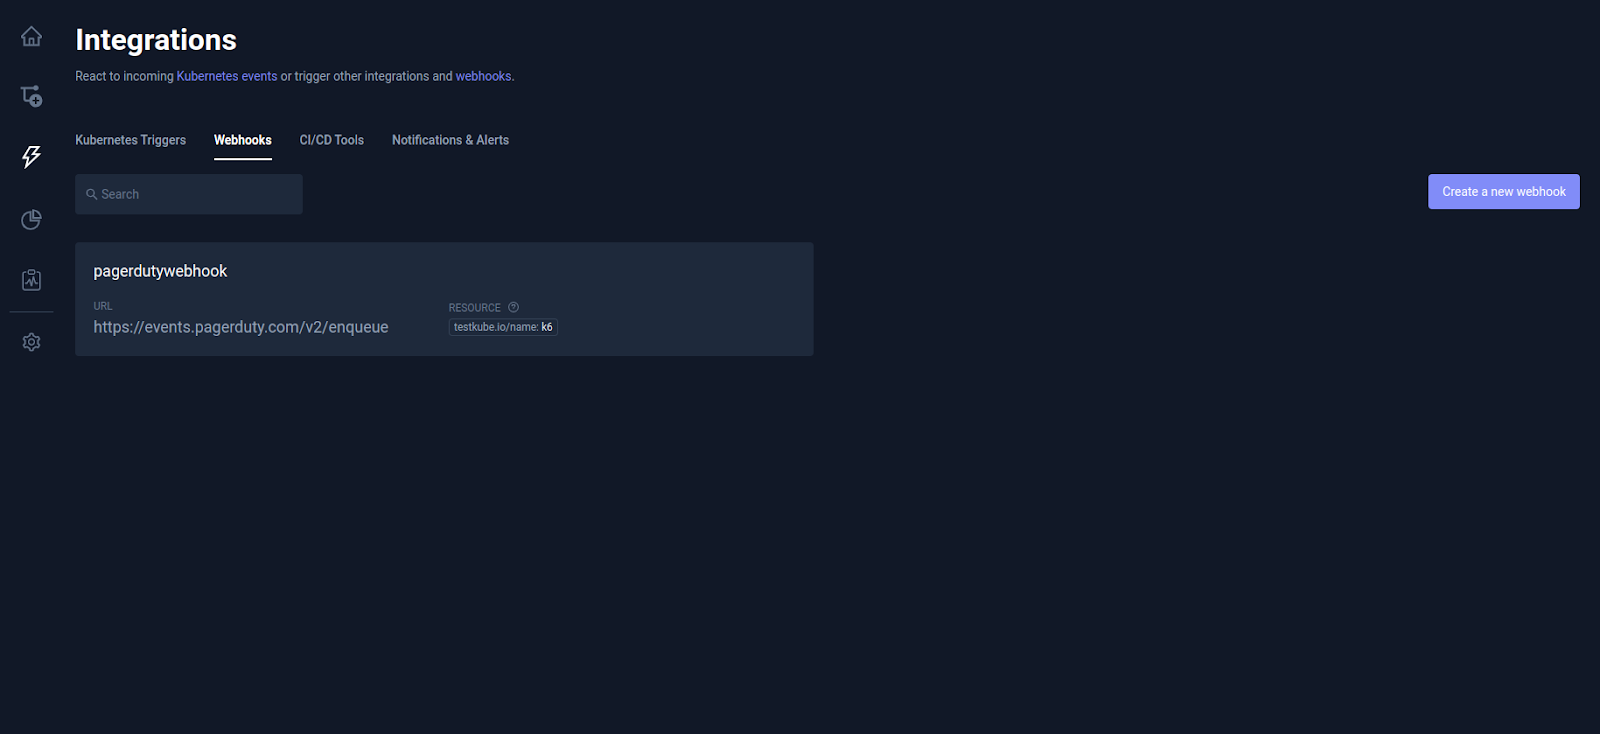
- A new webhook can be created by clicking the "Create a new webhook" button.
- Provide the following details to create the webhook:some text
- Name: a name for your webhook
- Resource Identifier: as any test workflow or executor on which you want the webhook to trigger. In this case, we will use a simple cURL test. You can find the test in this repo. We’ve changed the HTTP code in the test, so it fails.
- Triggered events: choose end-testworkflow-failed, which will trigger when the chosen test workflow fails.
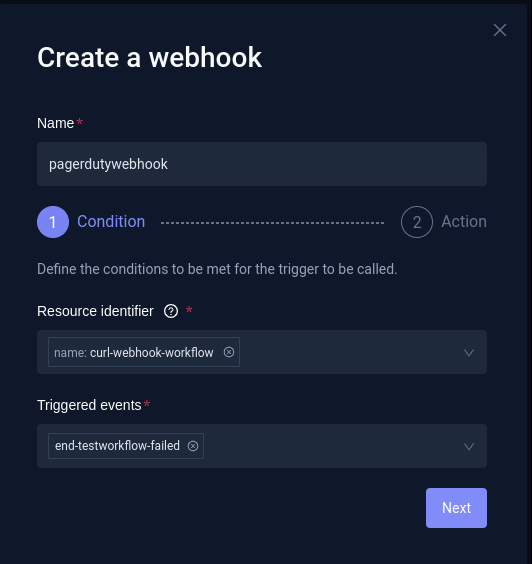
- On the next dialog. enter the PagerDuty endpoint URL you generated while configuring the PagerDuty integration with Testkube. This specifies where the event data will be delivered.
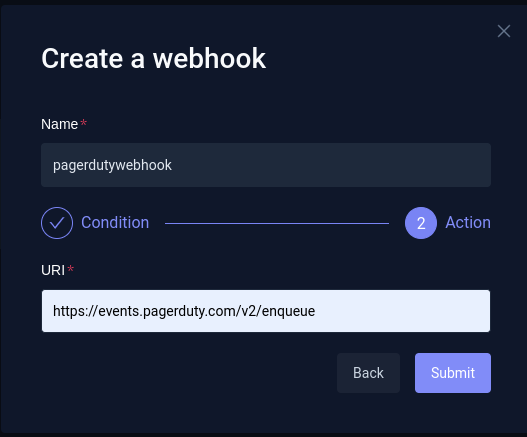
- Click on Submit, and your webhook is ready.
Though the webhook is ready, we want to pass on additional details about the test workflow execution to the webhook. We can do that by providing a custom payload.
As mentioned earlier, PagerDuty requires input in a particular format, as shown below:
Hence, we will add a custom payload. To do that, click your Webhook and navigate to the “Action” section. Here, add the following snippet under the “Custom Payload” section:
The payload above contains the following details:
- Test Workflow Name
- Test Workflow Status
- Test Workflow Endtime
- URL to the specific Test Workflow’s log
Note: Update your routing key from PagerDuty.
Click on “Save” to save the configuration.
Testing the Webhook
Now that we have configured the webhook for PagerDuty, it’s time to test it. To do that, simply run the cURL test workflow.

When the test fails, you’ll see the webhook trigger and send data to PagerDuty. Within PagerDuty, this will be shown as an incident based on the details we shared in the custom_payload.

You can expand the incident for more details and to view the custom payload that we’re sending.
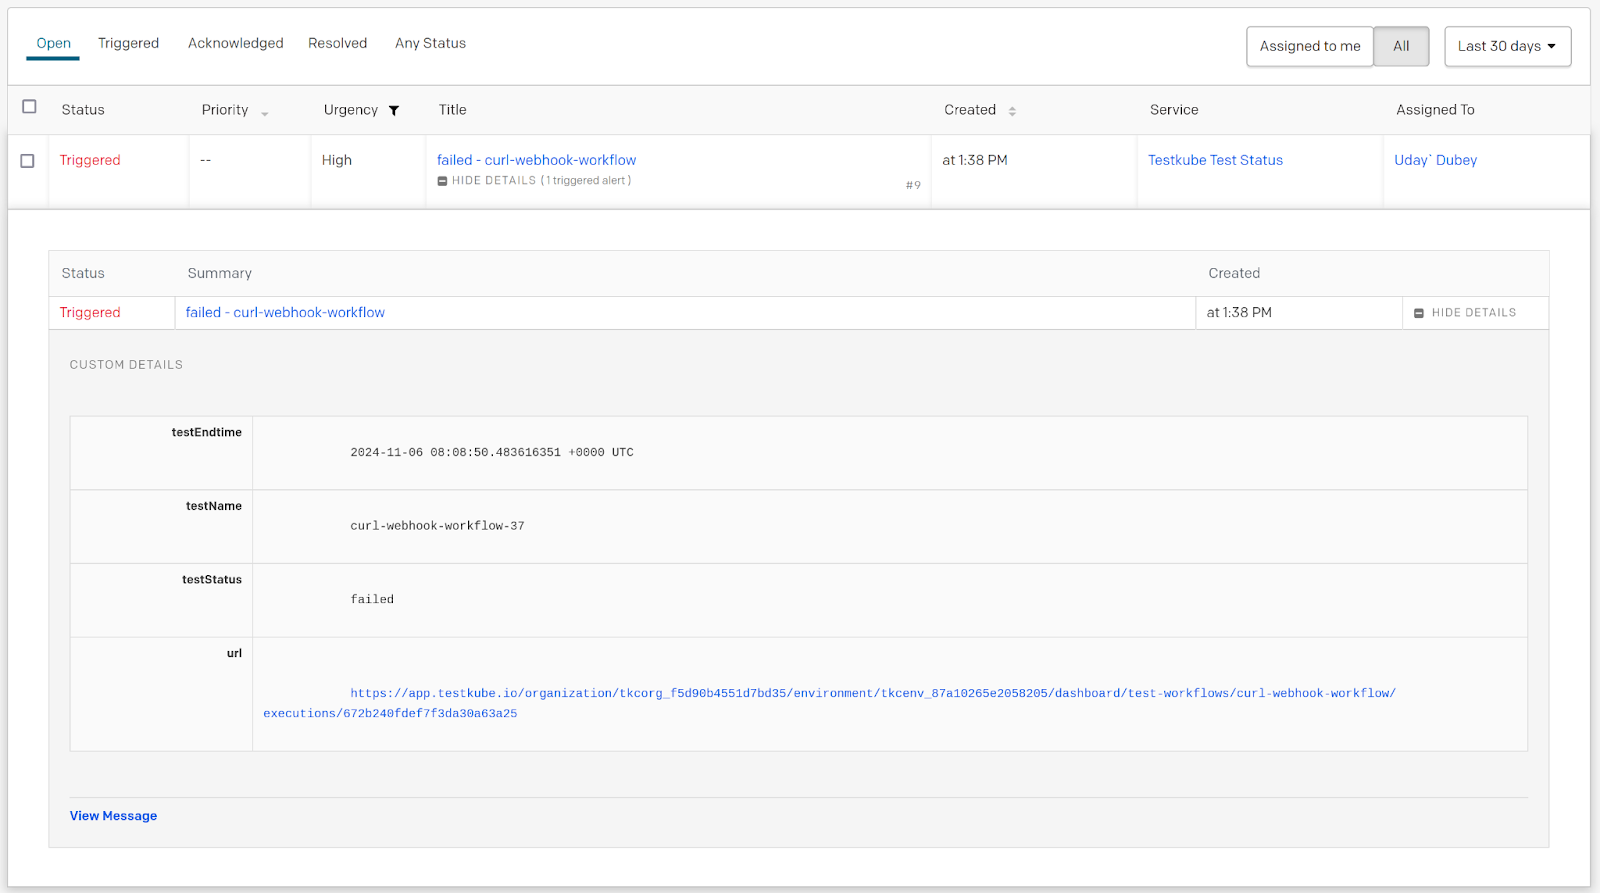
By default, PagerDuty also sets up an email alert triggered when an incident is created.
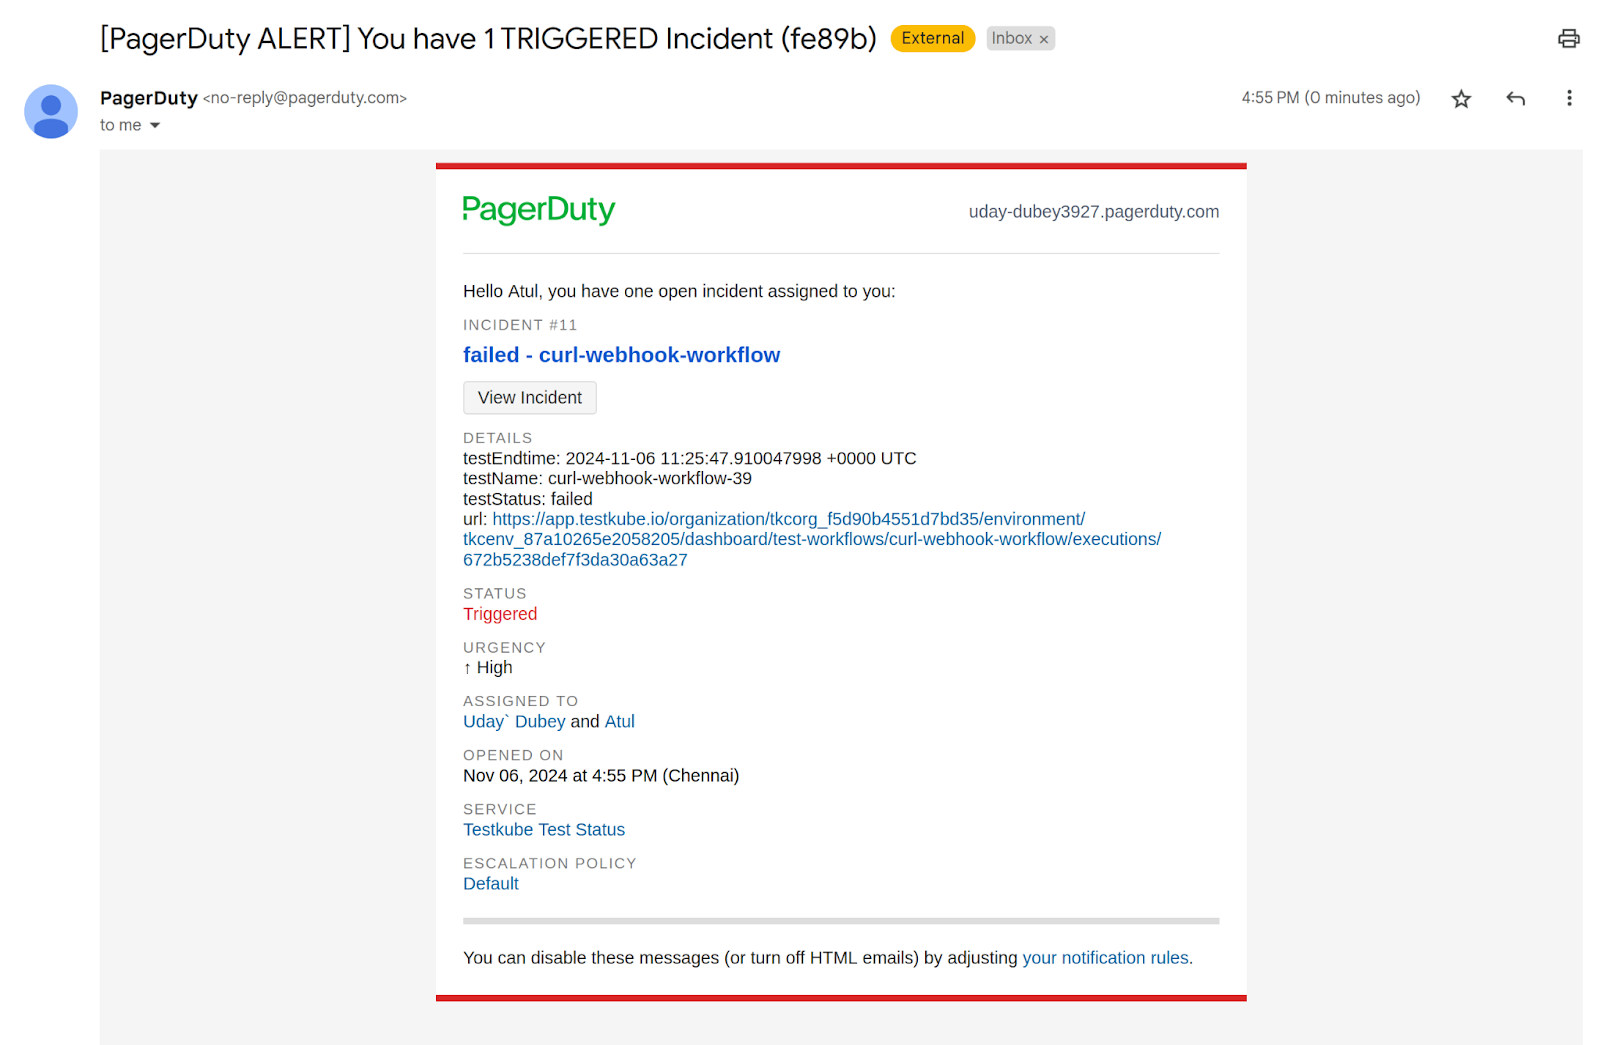
And that’s how you can configure the Testkube webhook to send alerts to PagerDuty. Based on your team’s specific needs, you can configure both Webhook and Testkube.
Enable Webhooks on State Changes
If you noticed in the above demo that the webhook is triggered every time the test workflow fails. For a test workflow that runs frequently and fails because of a bug, you don’t want to be swarmed with notifications and become alert fatigued.
Testkube solves this with its state-based alerting through 'becomes' events.
Rather than triggering alerts on every failure, notifications are sent only when a test's status changes—for instance, when a consistently passing test fails for the first time. This intelligent alerting ensures teams stay informed of meaningful changes without being bombarded by redundant notifications for known issues.
To do that, choose from any of the following trigger-events when creating your webhook:
- become-testworkflow-up (from any error state to succeed one)
- become-testworkflow-down (from succeed state to any error one)
- become-testworkflow-failed (from any state to failed one)
- become-testworkflow-aborted (from any state to aborted one)
Refer to the complete list of webhook state changes.
Conclusion: Elevate Your Incident Response with Testkube and PagerDuty Integration
Harnessing the synergy between Testkube and PagerDuty through webhooks offers a formidable solution to bolster your incident management strategy. This integration not only simplifies tracking and addressing critical test failures but also fosters improved teamwork.
By utilizing Testkube's automated testing capabilities alongside PagerDuty's robust incident management system, you equip your team with the necessary resources to uphold service excellence and enhance customer satisfaction. The combination of these tools facilitates a shared understanding, streamlined communication, and faster detection among development, QA, and operations teams, all of which are essential for the maintenance of high availability and reliability.
Discover the potential of Testkube and its versatile integrations. Embrace a system where proactive monitoring and seamless alerting transform your operational dynamics.
Connect with our vibrant community on Slack for insights, support, and networking with like-minded developers. Embark on a journey to redefine your approach to quality assurance and incident response, achieving resilience and agility in today’s fast-paced agile environment.


About Testkube
Testkube is the open testing platform for AI-driven engineering teams. It runs tests directly in your Kubernetes clusters, works with any CI/CD system, and supports every testing tool your team uses. By removing CI/CD bottlenecks, Testkube helps teams ship faster with confidence.
Get Started with a trial to see Testkube in action.


.png)